Hey Will, Take a look at this link, I found it on another thread. http://www.newsontool.com/02_33-34.html
Looks “easy” maybe it will help you…not sure if it is only for a lathe if it is for a lathe, my inexperience does make it difficult to help.
Will, you had mentioned before that you;d like to include the janka hardness in calculating (somehow). I may have found a way, only because you haven’t mentioned anymore about it. Let’s look at your Red Oak from above…
Your feed is 1905 mm/min and the Janka hardness of Red Oak is 1,290
If that Feed works out good and you now want to calculate for Red Mahogany than how about factoring the 2 wood’s Janka ratings as such…
Red Oak’s Janka is 1,290 and Red Mahogany’s Janka is 2,697, known feed rate times the known material’s janka divided by the new material’s janka.
So Red Oak Feed Rate of 1905 mm/min x’s (1290 / 2697 = 0.4783 ) = 911 mm/min Feed Rate for Red Mahogany.
Found this at http://www.precisebits.com/tutorials/Guesstimating_Feed_Rates.htm
Hope this helps, Jude
Also found this that might help including the HRC but I’m only concerned about wood… http://www.mmsonline.com/articles/hard-milling-by-the-number
Lets give this a shot Will.
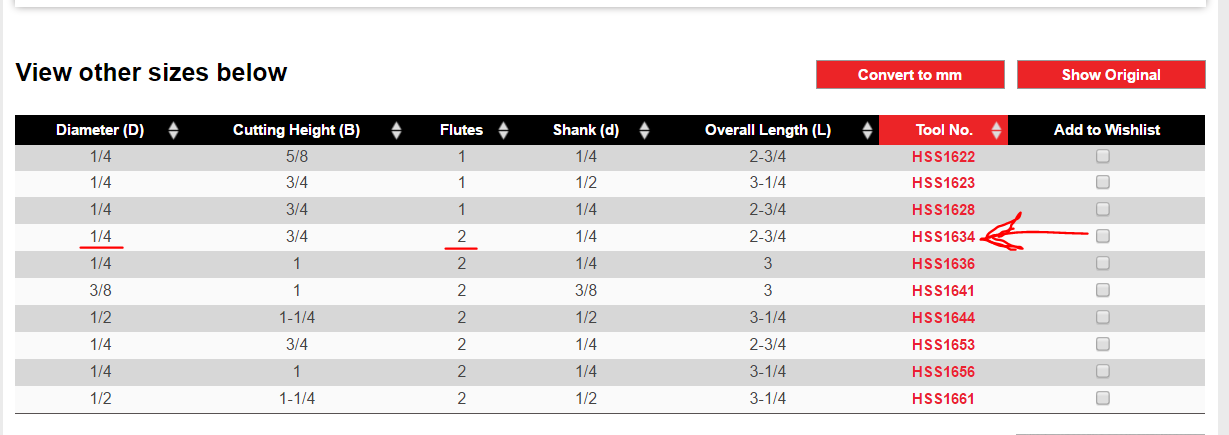
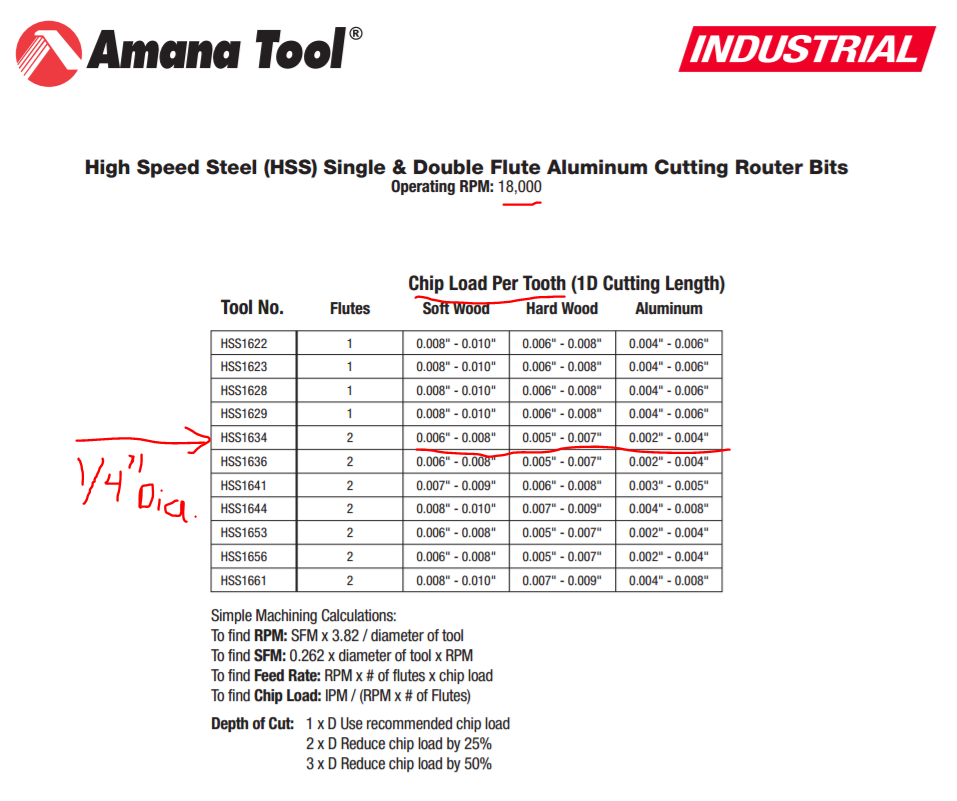
I looked at the Amana tool catalog and picked HSS1634 because it is 1/4" 2 flute end mill except for the carbide close to Carbide3d’s and I think Amana makes the Carbide3d end mills.
and than I worked up a feed and speed excel spread sheet using their 18,000 RPM and their chip load.
Now I also wanted to try that Janka comparison idea with Red Oak to Red Mahogony.
The feed rate equaled 106.7 mm/sec for the red oak, I used the max chip load on the red oak. The Janka conversion resulted in 51 mm/sec feed for the harder mahogony. To try to reach that feed rate I had to reduce the RPM and the mahogony chip load. But, on the wiki shapeoko 3 materials, list for mahogony it shows a feed rate of 1651 mm/min or 27.6 mm/sec and it seems had to justify the 51 mm/sec of the spread sheet as well as the 106.7 mm/sec (4 inches / sec) for the red oak. Granted that I know nothing about this stuff and really trying to learn, I am very confused. Calculated the chip load X’s the #'s flutes X’s RPM for the Feed Rate. I could accept that I am just too inexperienced to try this exercise.
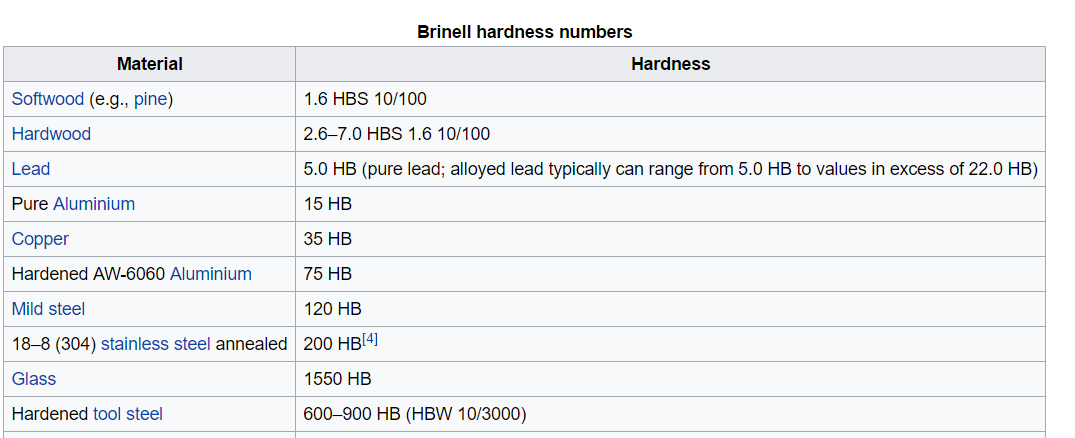
For the fun of it, here is the brinell hardness numbers for hardwoods and hardened aluminum just to compare how much the Janka scale may relate to cutting metals, not much I presume ( 7hardwood to 75 6060 aluminum).
.
I just read the newest topic and your reply to Evan. I will reply in turn for you to myself because I thinks this directly applies to me too. Thanks Will.
Thanks for the “like” Evan, maybe I should just join your club.My one and only member is ready to jump ship. ouch!
Forget that, I’m back on my team…But I like adding the cutter diameter into the equation. And But I’ll still work thru the tutorial before I really try this with the Shapeoko. Another try like before but see lower view, hope pic explains itself.
Haven’t yet been able to wrap my mind around the Jupyter notebooks, but did hit upon another way to present this data, so got started w/ a chart which lists feeds and speeds in rows and columns and materials at the intersections — since one can do a textual search, one can pull up where things are, and I think it’s interesting to see adjacent materials &c.
I think it’ll be useful at least for extrapolating feeds and speeds for similar materials, and evaluating them to determine if they make sense. Entering the 1/8" endmill values to start, and will be putting in as much from the Materials page as will fit — we’ll see how it works out.
Editing the Wikimedia markup to add entries is tedious, to say the least.
I think the solution here is some sort of programmatic tool which would have a number of features:
load tool and feed / speed data somehow, either via external files, or from a database — either way, we need a formal description of how to describe a tool, and feed / speed data — I’ve noted in the past that I’m mystified there’s no industry-standard for this. I’ve suggested XML, and @robgrz was vociferously opposed — given that his MeshCAM is the only tool which seems to have support for this (see: https://www.shapeoko.com/wiki/index.php/MeshCAM#TPS_files ) I think that carries more weight than the old rejoinder of, “XML is like violence, if it doesn’t solve your problem, use more.”
display said data in nice charts or tables — it’s always seem strange to me that data visualizations are so beautiful in sci-fi movies and TV, but the tools for it are so primitive and tend towards clunky as appearance (and I say that as a guy whose 6 longest weeks of his life were doing the composition for Kaplan’s Introduction to Scientific Computation and Programming) — is there nothing which does for charts and tables what TeX did for text and mathematical equations (and no, as much as I love the Booktabs package, directly setting tables in TeX is not an acceptable answer)? Ages ago, found a graphical tool which would import a pixel image of a chart and derive the underlying, but unfortunately haven’t been able to find it since.
Maybe a Trello chart? (it seems to work pretty well for the Nomad stuff: https://trello.com/b/hqyIBPYR/carbide3d-nomad-cheatsheet ) — considered Airtable, but it didn’t appeal — if nothing else turns up, I’m probably just going to stuff things into (individual?) CSV files and typeset a table using TeX — if the community is willing to accept pixel images for this sort of thing, a PDF ought to be acceptable as an improvement.
Other options:
nodebox
processing
some sort of javascript library to directly create an SVG
a series of text files which are imported into METAPOST and then drawn into a table
a series of text files which can be loaded into pandoc
open to further thoughts / suggestions.
In a lot of ways, this goes back to my idea for a machinist’s notebook.
Finished up adding all the official feeds and speeds to the table (made using booktabs and the LaTeX picture environment for those who’re curious). Next up will be doing something a bit more useful w/ it.
I appreciate your unending efforts… this appears to be an enormous task you have endeavored to see to a success, wish you all the luck and good fortune, unfortunately that is all I can offer. Thank you Jude
Thanks! What numbers would you wish to see? You can get the values for a given point by mousing over it.
@cgallery — I’ll have to see. One can drill down to a specific datapoint by clicking on the sets you’re interested in — clicking on the material you want, is pretty effective. When we add more values I believe it will continue to be pretty effective.