Hi all,
I think it would be nice to have a colormap applied to a simulated 3D surface in order to better visualize height differences (including a legend).
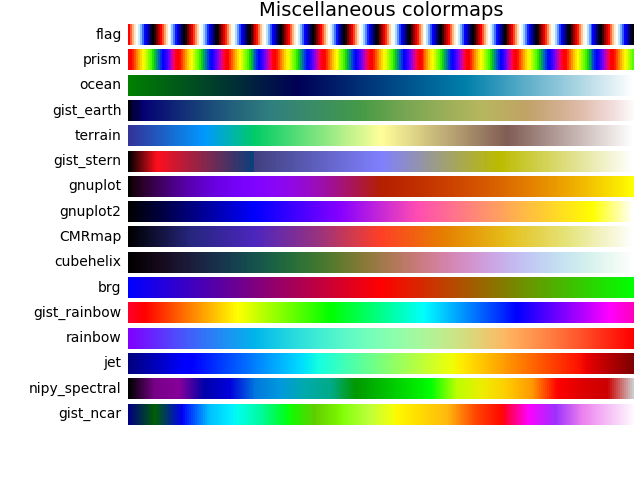
While there is a whole bunch of possible color combinations (see examples from matplotlib below), I think a map with multiple colors like the gnuplot one should do well.
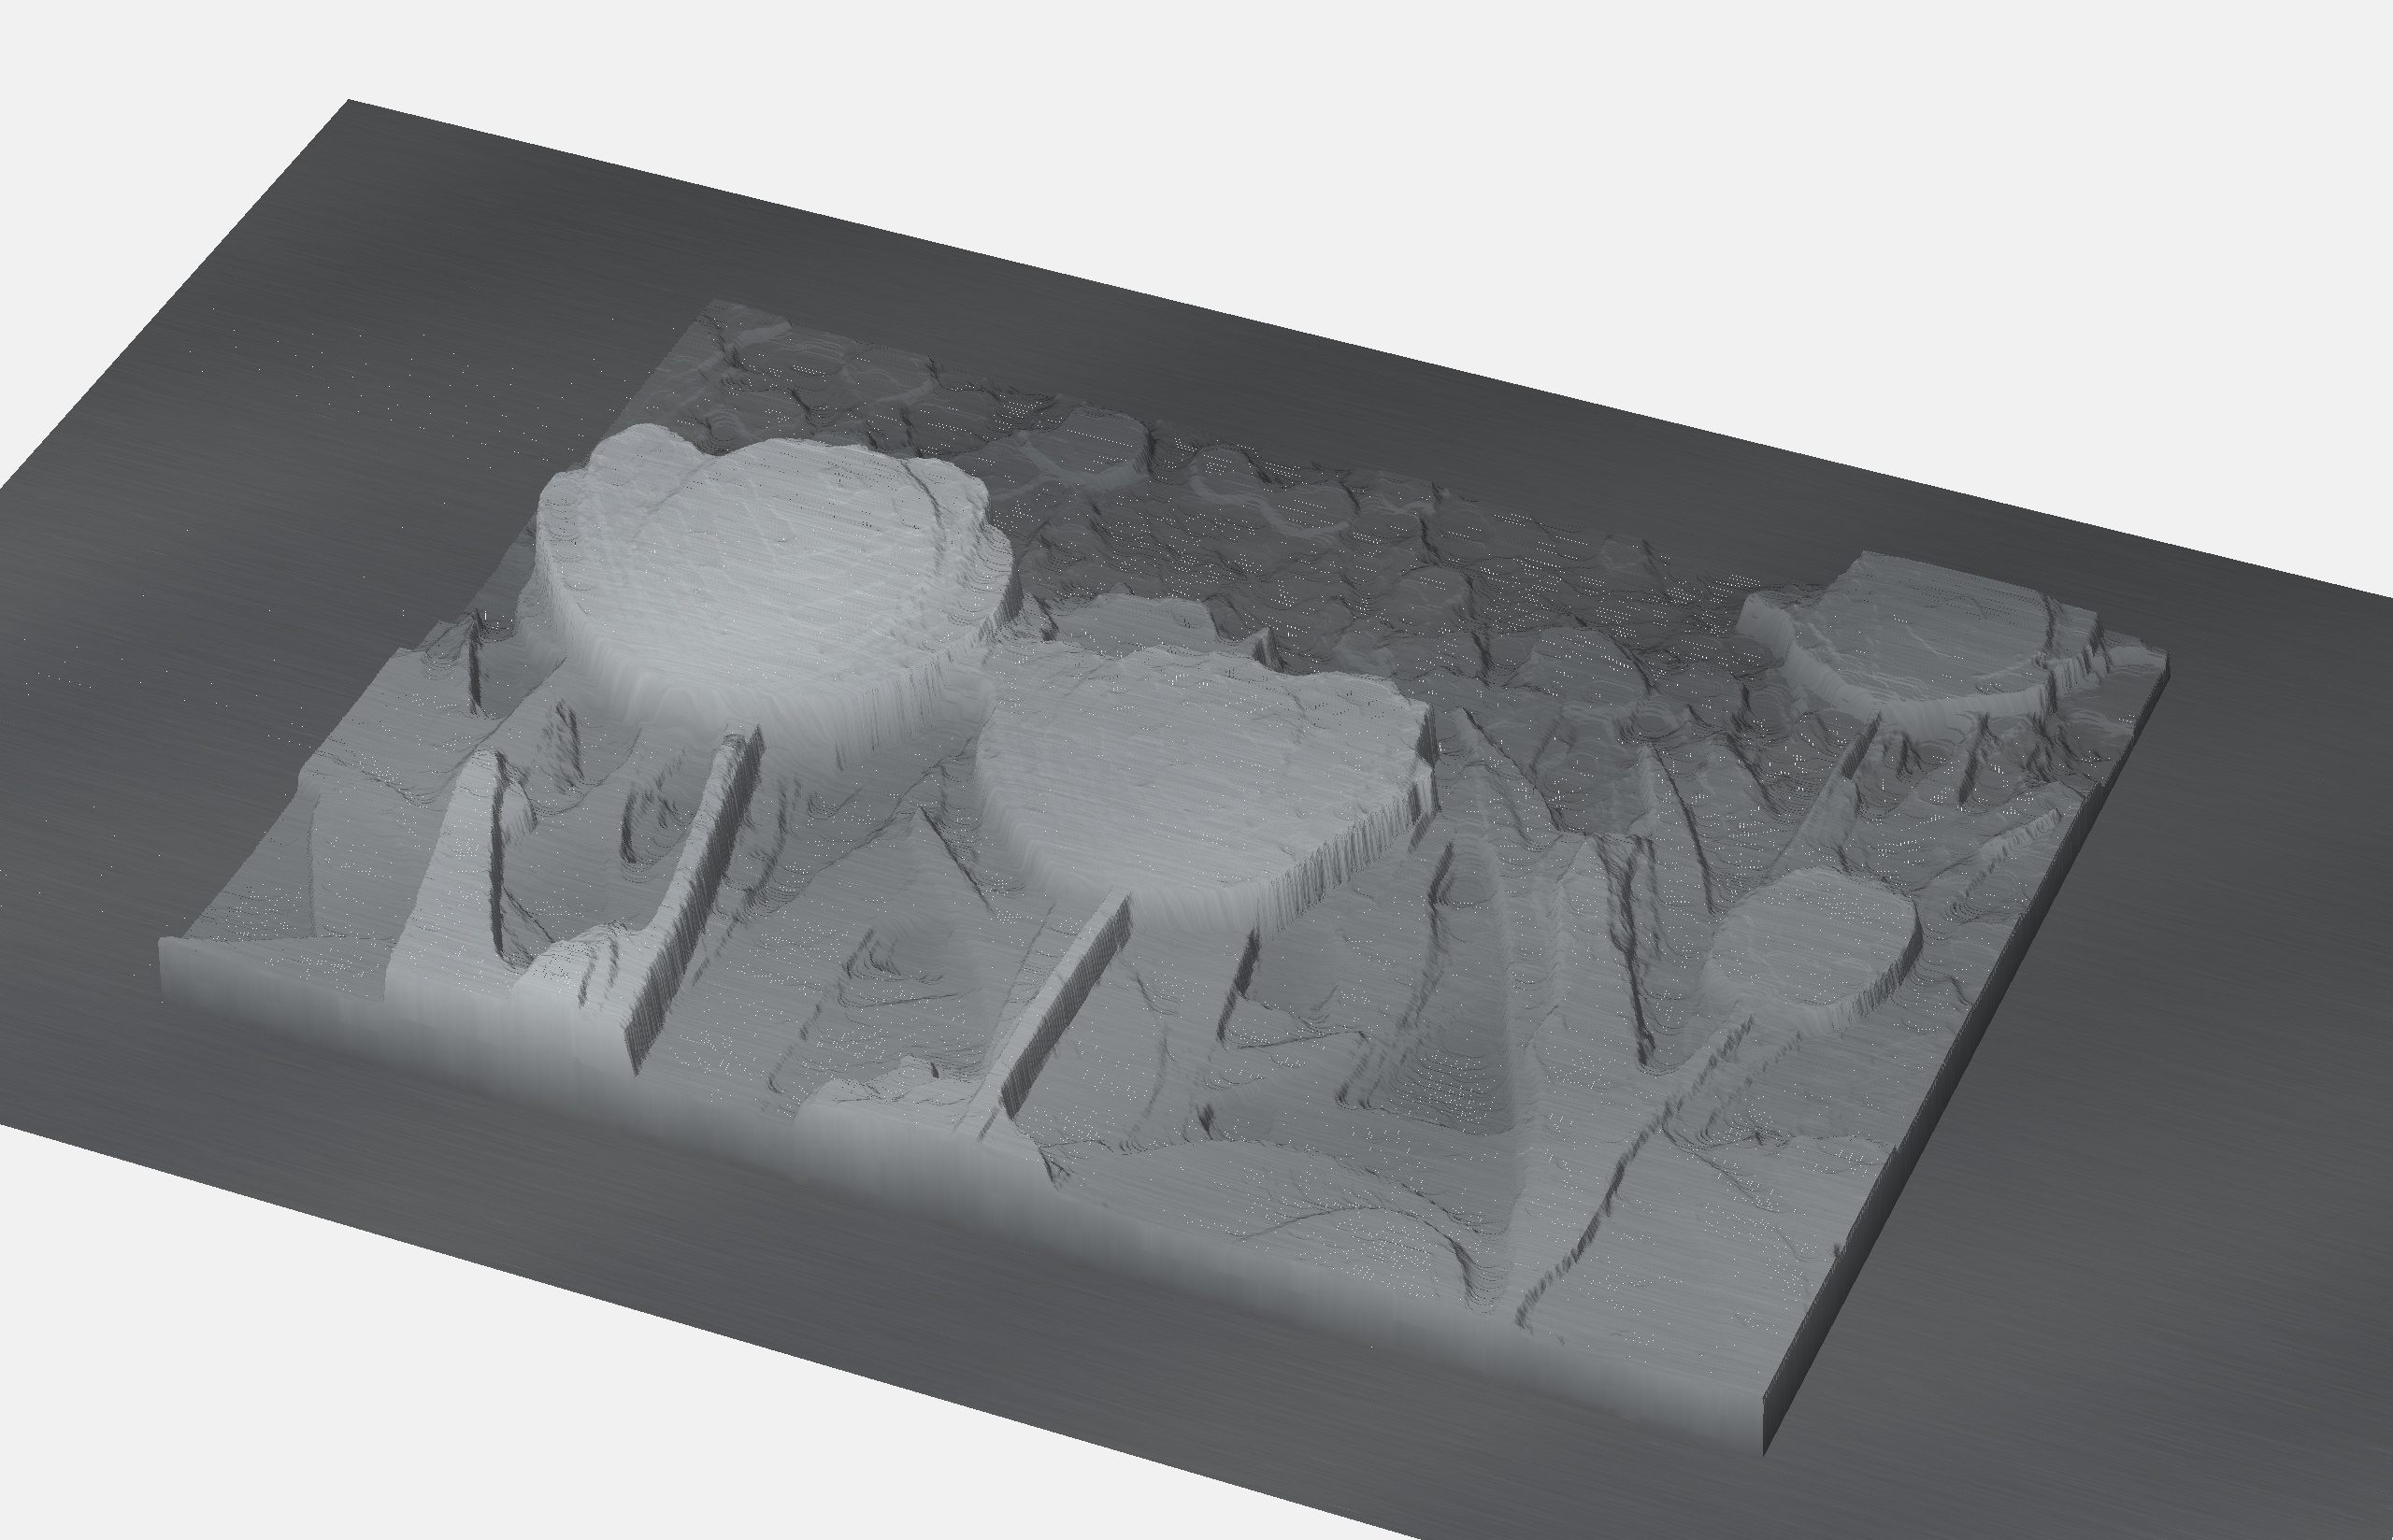
So instead of seeing something like this:
One might see this (default matlab color map, ignore the axis labels):
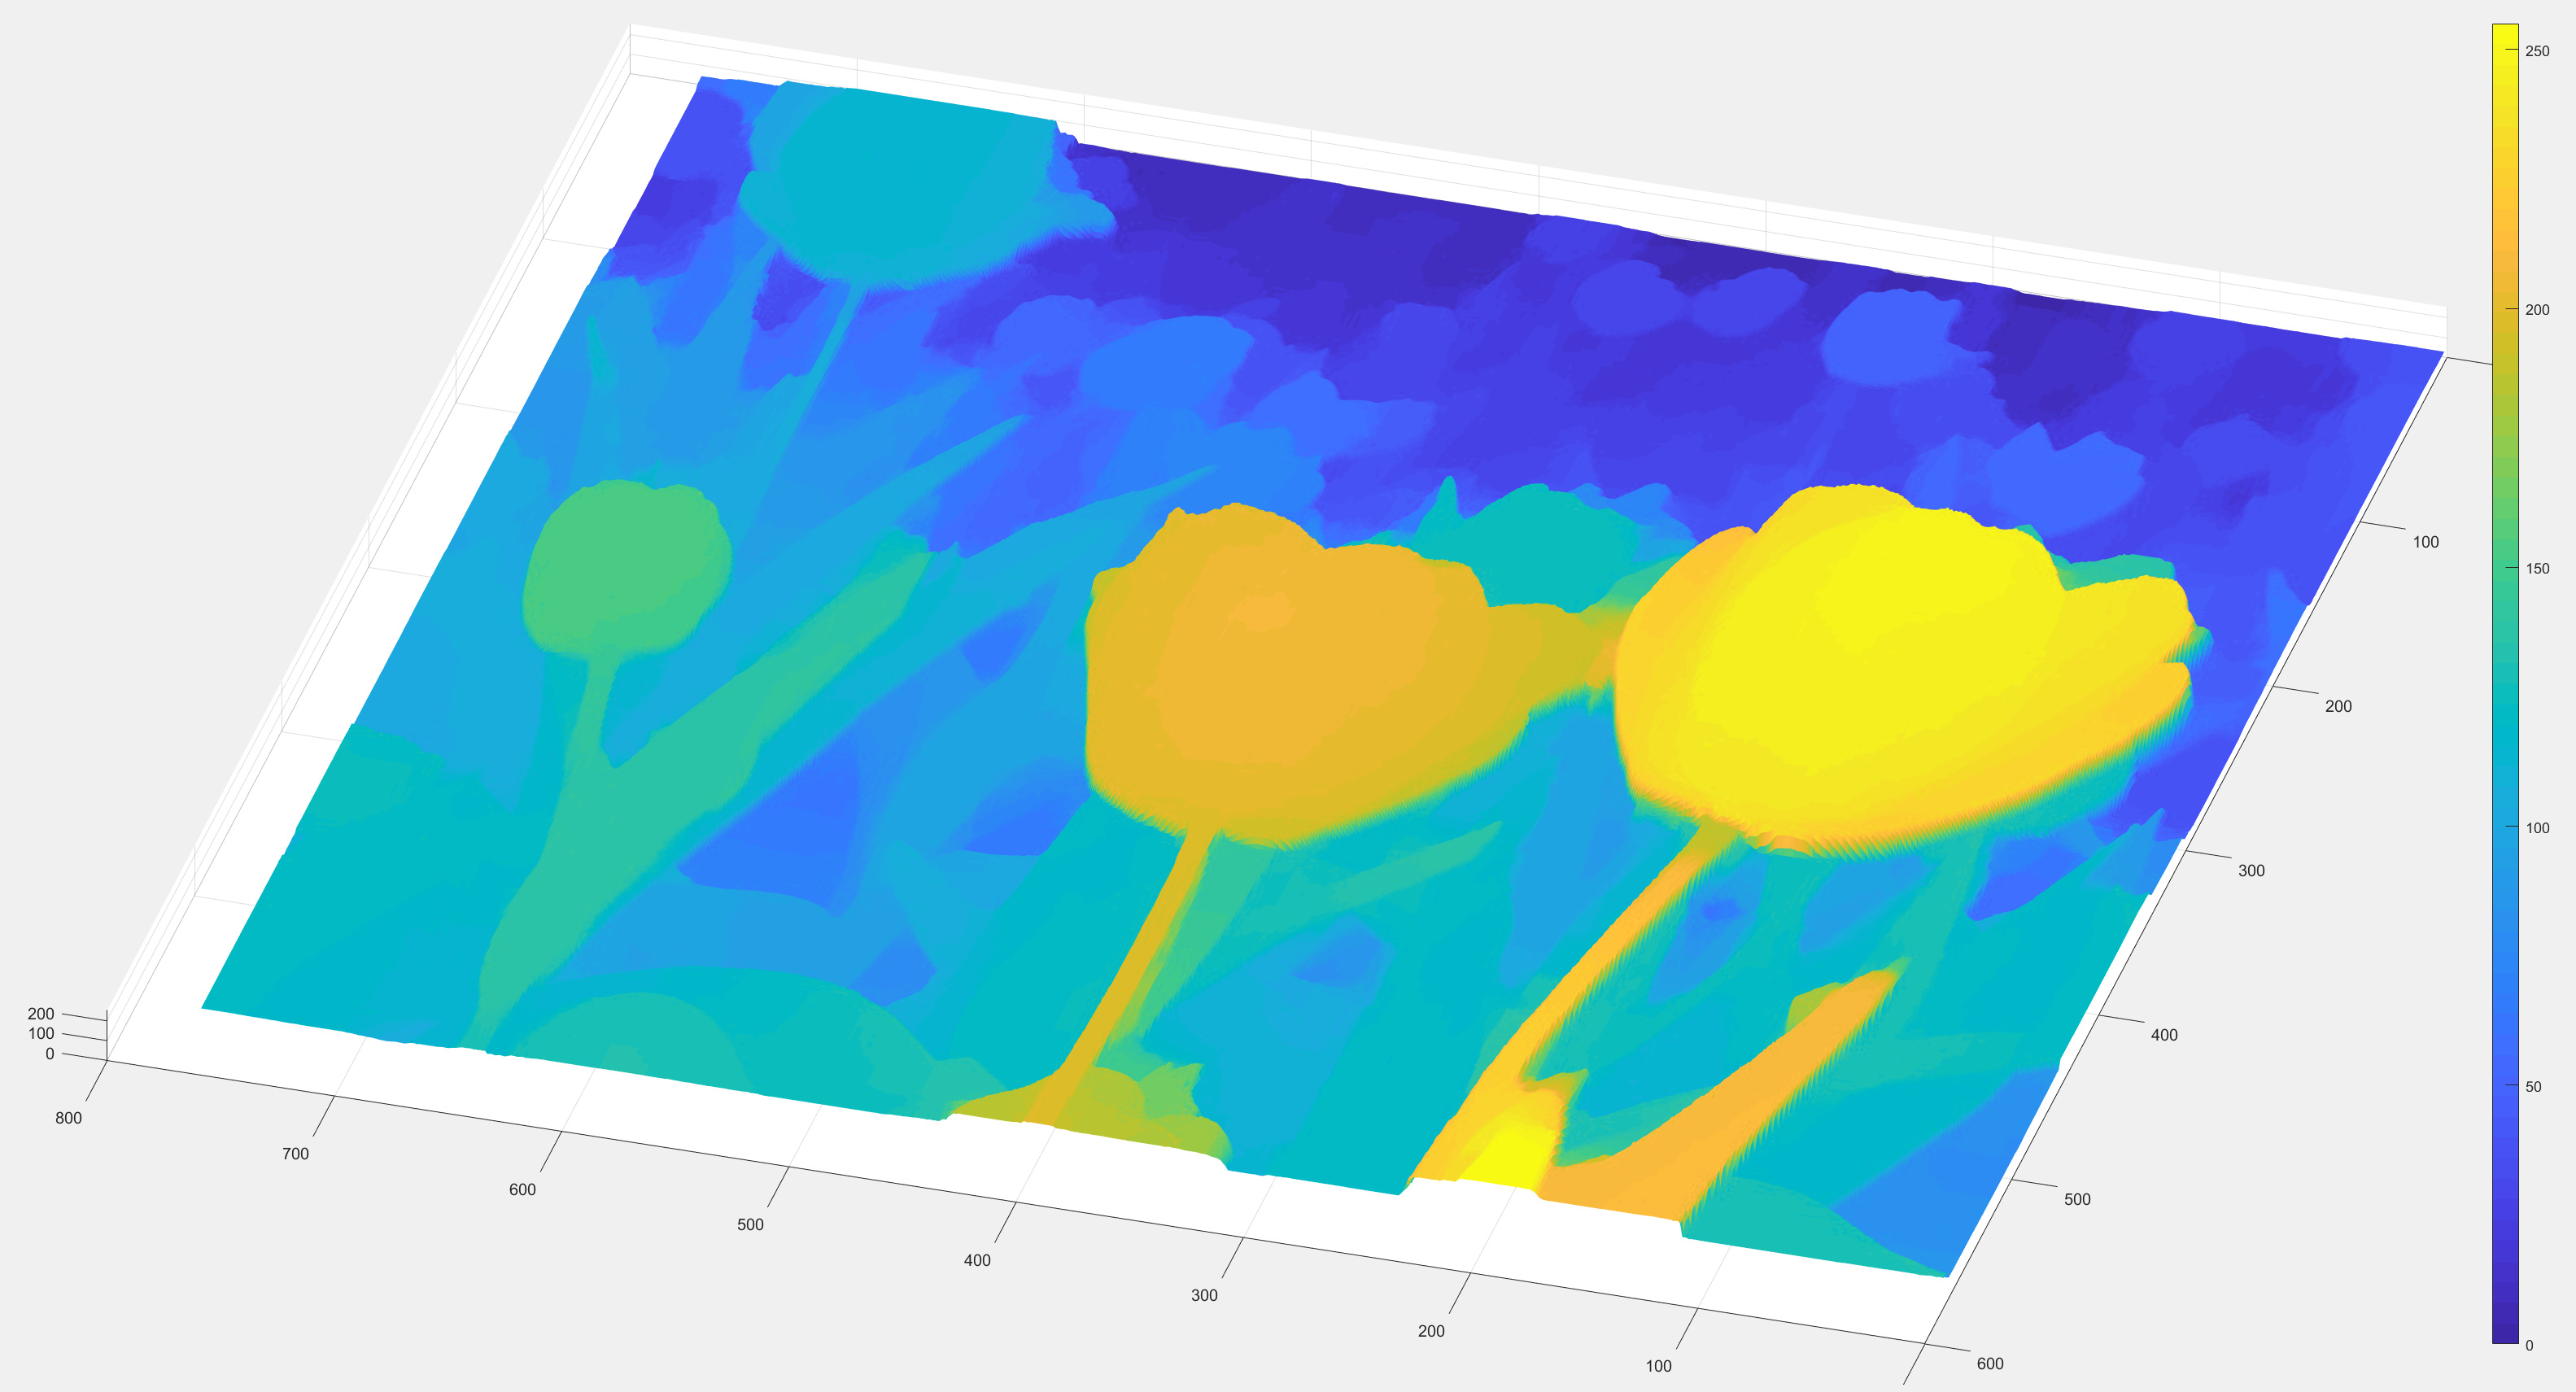
A benefit would be that one could estimate the depth of a v-carve, so that one can adjust feeds&speeds w.r.t. the maximal cutting depth or adjust critical (too deep) areas in order to reduce the maximal depth.
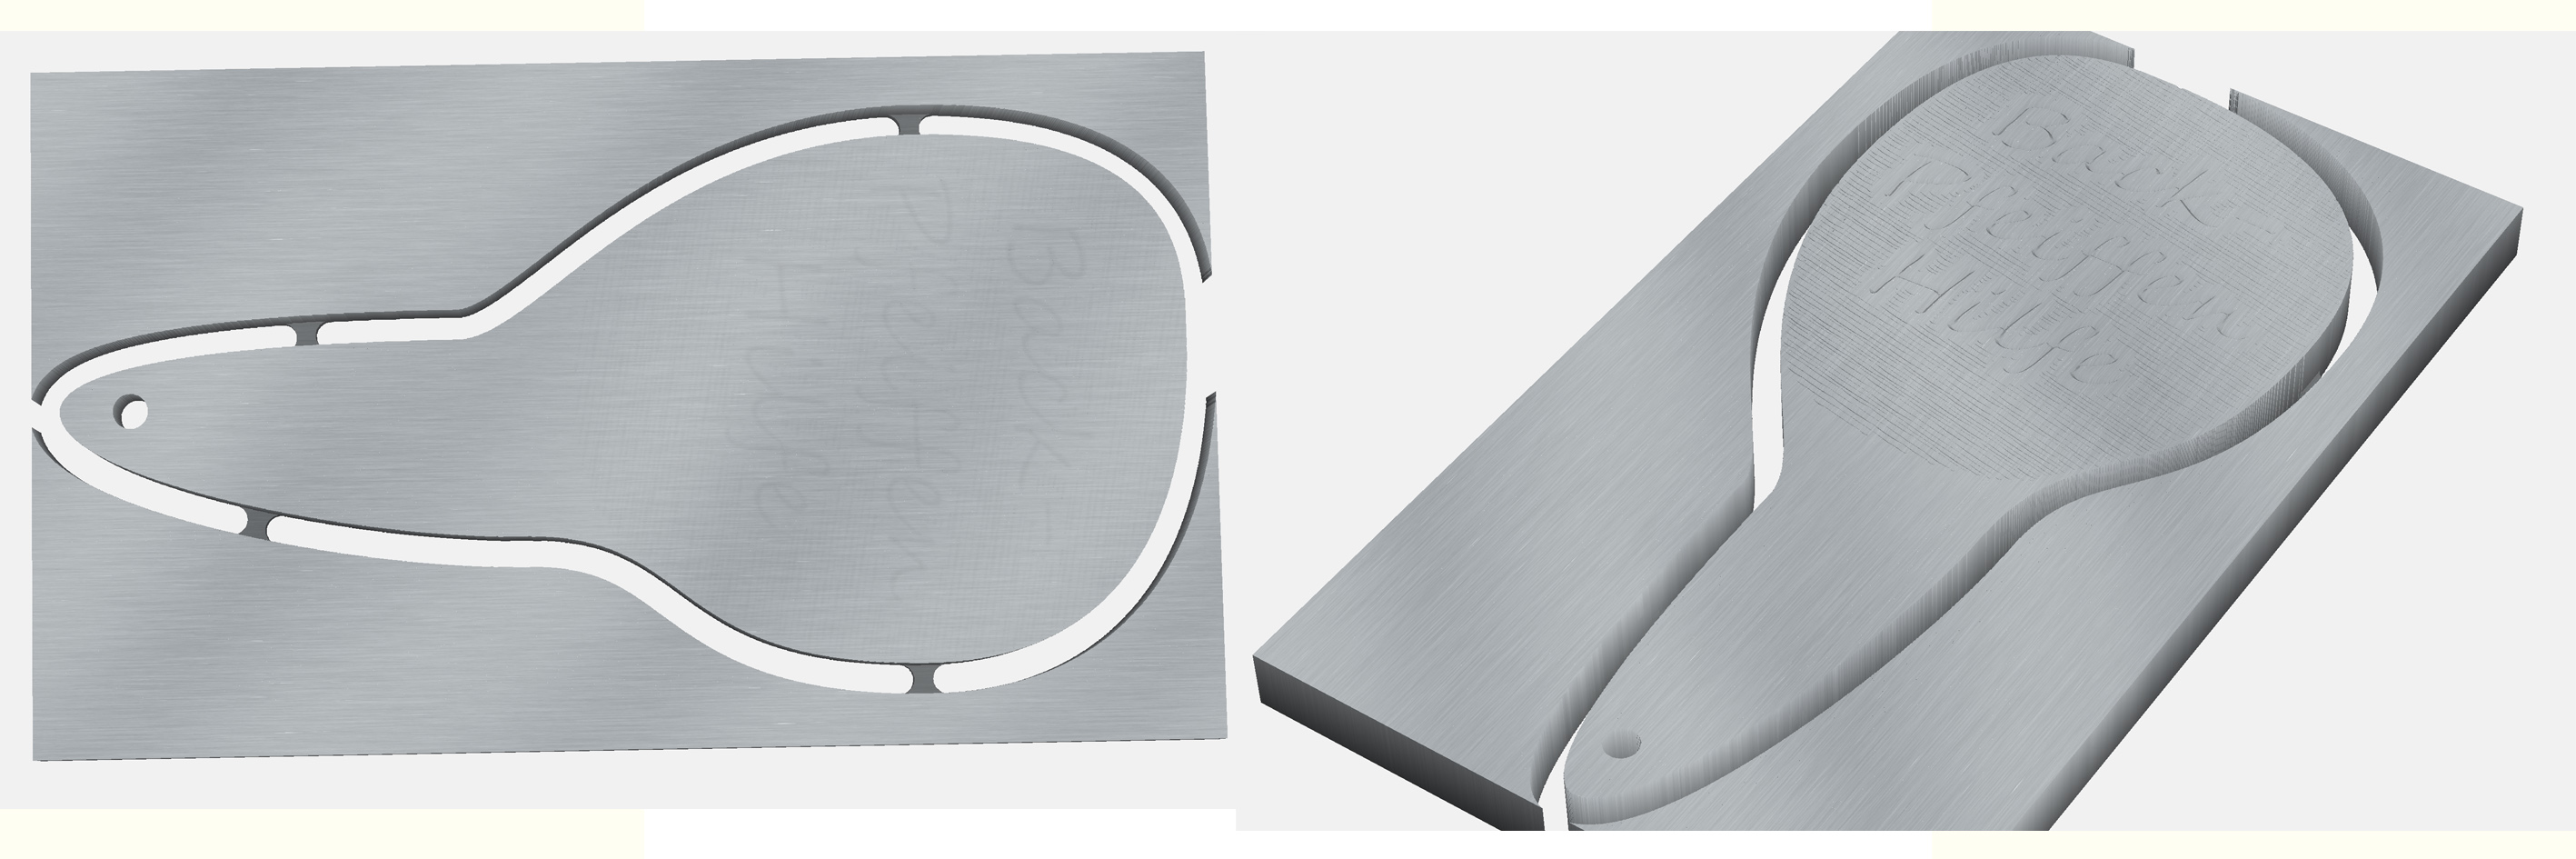
Furthermore, features will be better highlighted. Currently the shading is view dependent (light source seems to be attached/relative to the camera?) and therefore it is sometimes hard to find an angle which delineates all the features well:
Regards
Nils