I’ve been kind of frustrated with the simulation speed in CC, as on my macStudio (M2 Max), even the slowest setting is almost instant. I recently got a Windows laptop (AMD Ryzen AI 7 350 / AMD Radeon 860M) and tried some of the same project files there and the simulation speed range was totally different, vastly slower. Is the speed at which the simulation runs based on clock time, or CPU speed, or GPU speed? I’m curious why it’s so different and if there’s a way to slow it down on the macStudio.
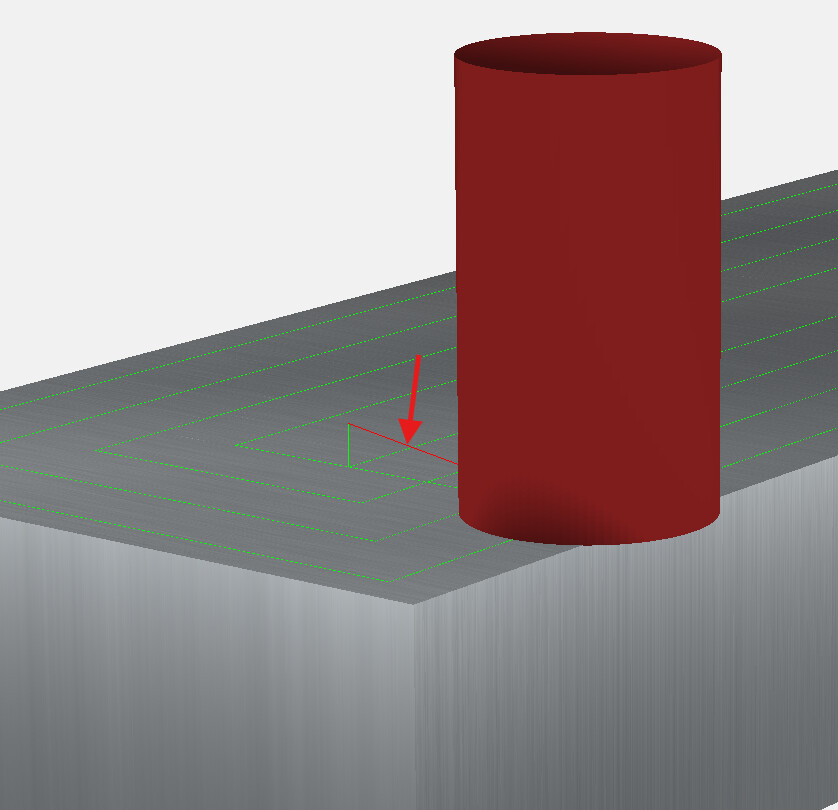
This is a super-simple surfacing tool path but shows the behavior. When the speed setting is at slowest, it takes maybe fraction more than 1 second to run. If I move the slider over more than 1/8 of the range, the render becomes instant… I don’t even see the tool move.
I was just trying some other older project files and it’s inconsistent. With other tool paths, I can slow the simulation speed down to a crawl, and the fastest speed takes about 8 seconds to complete. I’m running these on CC v8.
The second file you posted is kind of interesting in that the tool path rendering is fastest when the speed slider is at 50%. Beyond 50% it starts to slow down.
Same results with CC831 and CC815.
Macbook Air M4
macOS Tahoe 26
What’s happening behind the scenes is that the simulation is jumping from one point to the next. It doesn’t actually show what happens in between point A and point B, just before and after. For really simple toolpaths like what you shared, there’s only a couple lines of gcode. The simulation’s going to fly through it within a couple frames no matter what. A complicated contour that requires lots of little moves will take much longer to “simulate”. How long a simulation takes is not proportional to how long it’ll actually take to run, but instead how many lines of code there are.
I can’t speak for the dev team, but I believe this is being done to conserve computational resources. It’s not a bug, this is just how it’s meant to work.
I too, have noticed some inconsistencies. For the very small paths, like your surfacing path, I turn the speed all the way down & use the “Step” button. It seems usually it moves one line at a time, but not always???
The step function seems to have a new behavior, unless I just missed it before. It wraps around back to the beginning of the path & plays it again after getting to the end.
In the Tenzin Surfacing file, when you step to the last retract, it draws an extra rapid line back to the zero point?
Ah, that makes sense. I wasn’t sure if the gcode was translated into an intermediate format before being rendered as the simulation. So the Play button is conceptually automating the step button. I notice that the speed slider also changes how many steps are processed per press of the Step button. So for small paths I can just step at the slowest slider setting instead of using play.
Thanks!
If I understand it correctly, there is an internal toolpath that gets stored that contains the motion & control events. That internal toolpath gets post-processed to create the G-code.
So the simulation occurs before / independently from post-processing.
I think, regardless of path size, the slowest setting and the step button should move 1 step. The faster settings appear to be a percent of the total size?
I frequently find myself wanting to watch a particular portion of a toolpath in single-step mode.
Particularly when there is an issue I’m trying to resolve.
Seeing a listing of the events/motions while simulating would be extra helpful.