Spindle + Accelerometer =?

Can’t remember exactly how the idea got into my head but for a while I’ve been putting off attaching an accelerometer to my spindle to measure “stuff”.

I finally got around to it:

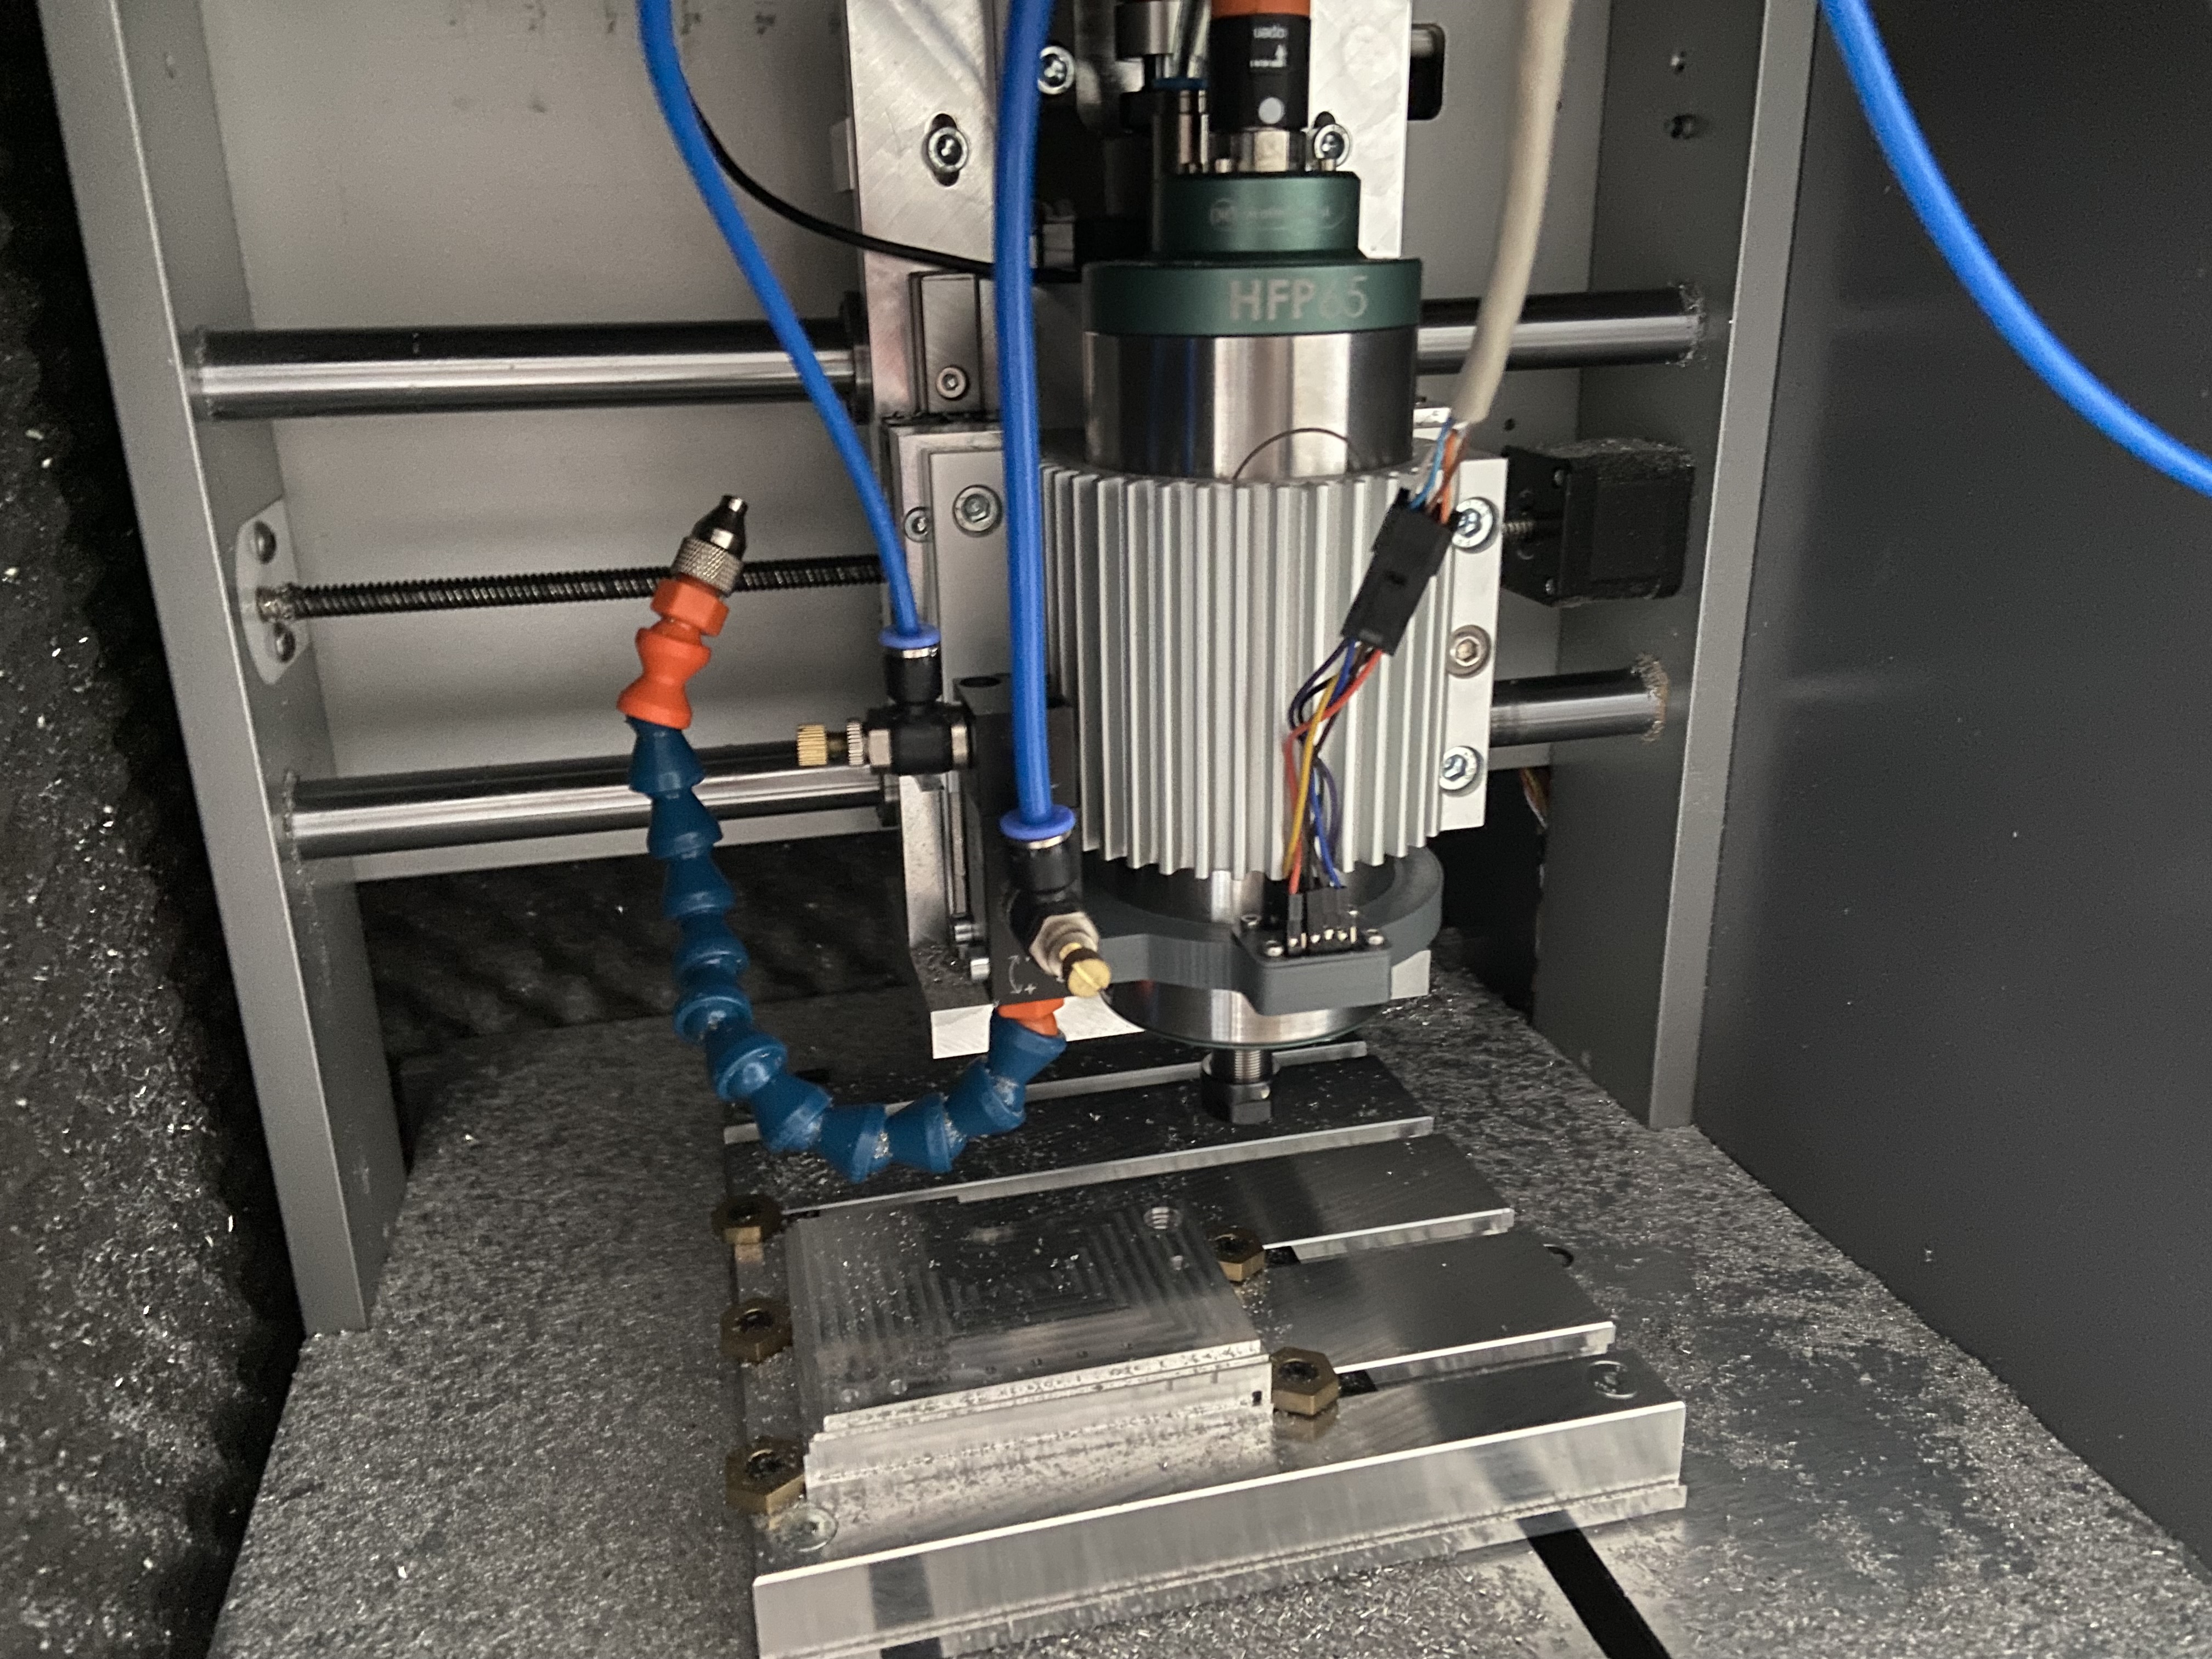
It’s a 3D printed mount that clamps around the spindle body and has two slots for M4 nuts (for the MQL nozzle) and a little space in the front to hold an Adafruit ICM20649 breakout board. Attached to it via dupont connectors is a Molex Micro-Fit 3.0 connector, which connects to a 1m-long Cat 6 ethernet cable which has the same pile of connectors on the other size, except the dupont connectors go to a Teensy 4.1 running an Arduino sketch.

The Teensy 4.1 currently just spams SPI asking for data and spits it back over UART as CSV when it receives it. I then capture the UART output with my laptop.

That’s the setup and I haven’t done any cutting yet but I have done a few experiments. I wanted to test the following hypotheses:

  • Does the collet make a difference (e.g. due to concentricity)?
  • Does tool length make a difference (e.g. due to amplifying errors in concentricity)?
  • Does the tool diameter make a difference (e.g. due to mass)?
  • Does the tool make a difference?

To test each of these hypotheses, I kept all else constant and changed the variable in question. In all cases, I ran a ramp from 5k RPM to 30k RPM, held the spindle at 30k RPM for 5s, stopped, waited until I didn’t hear anything else and then stopped capturing.

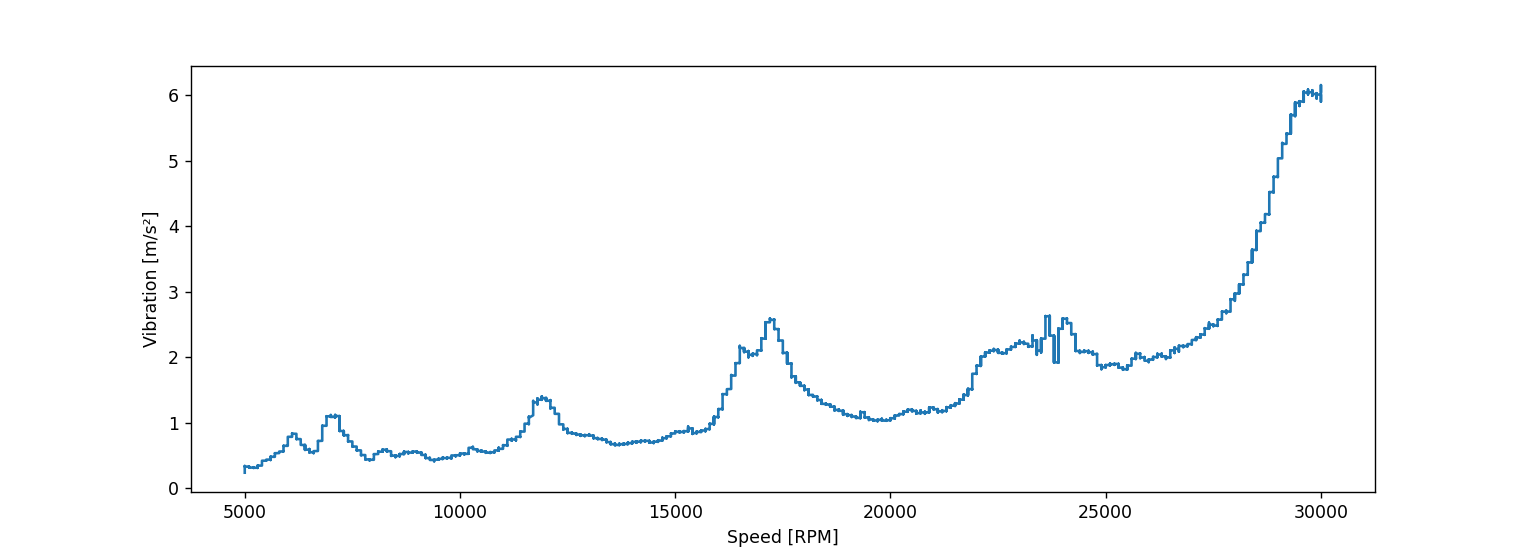
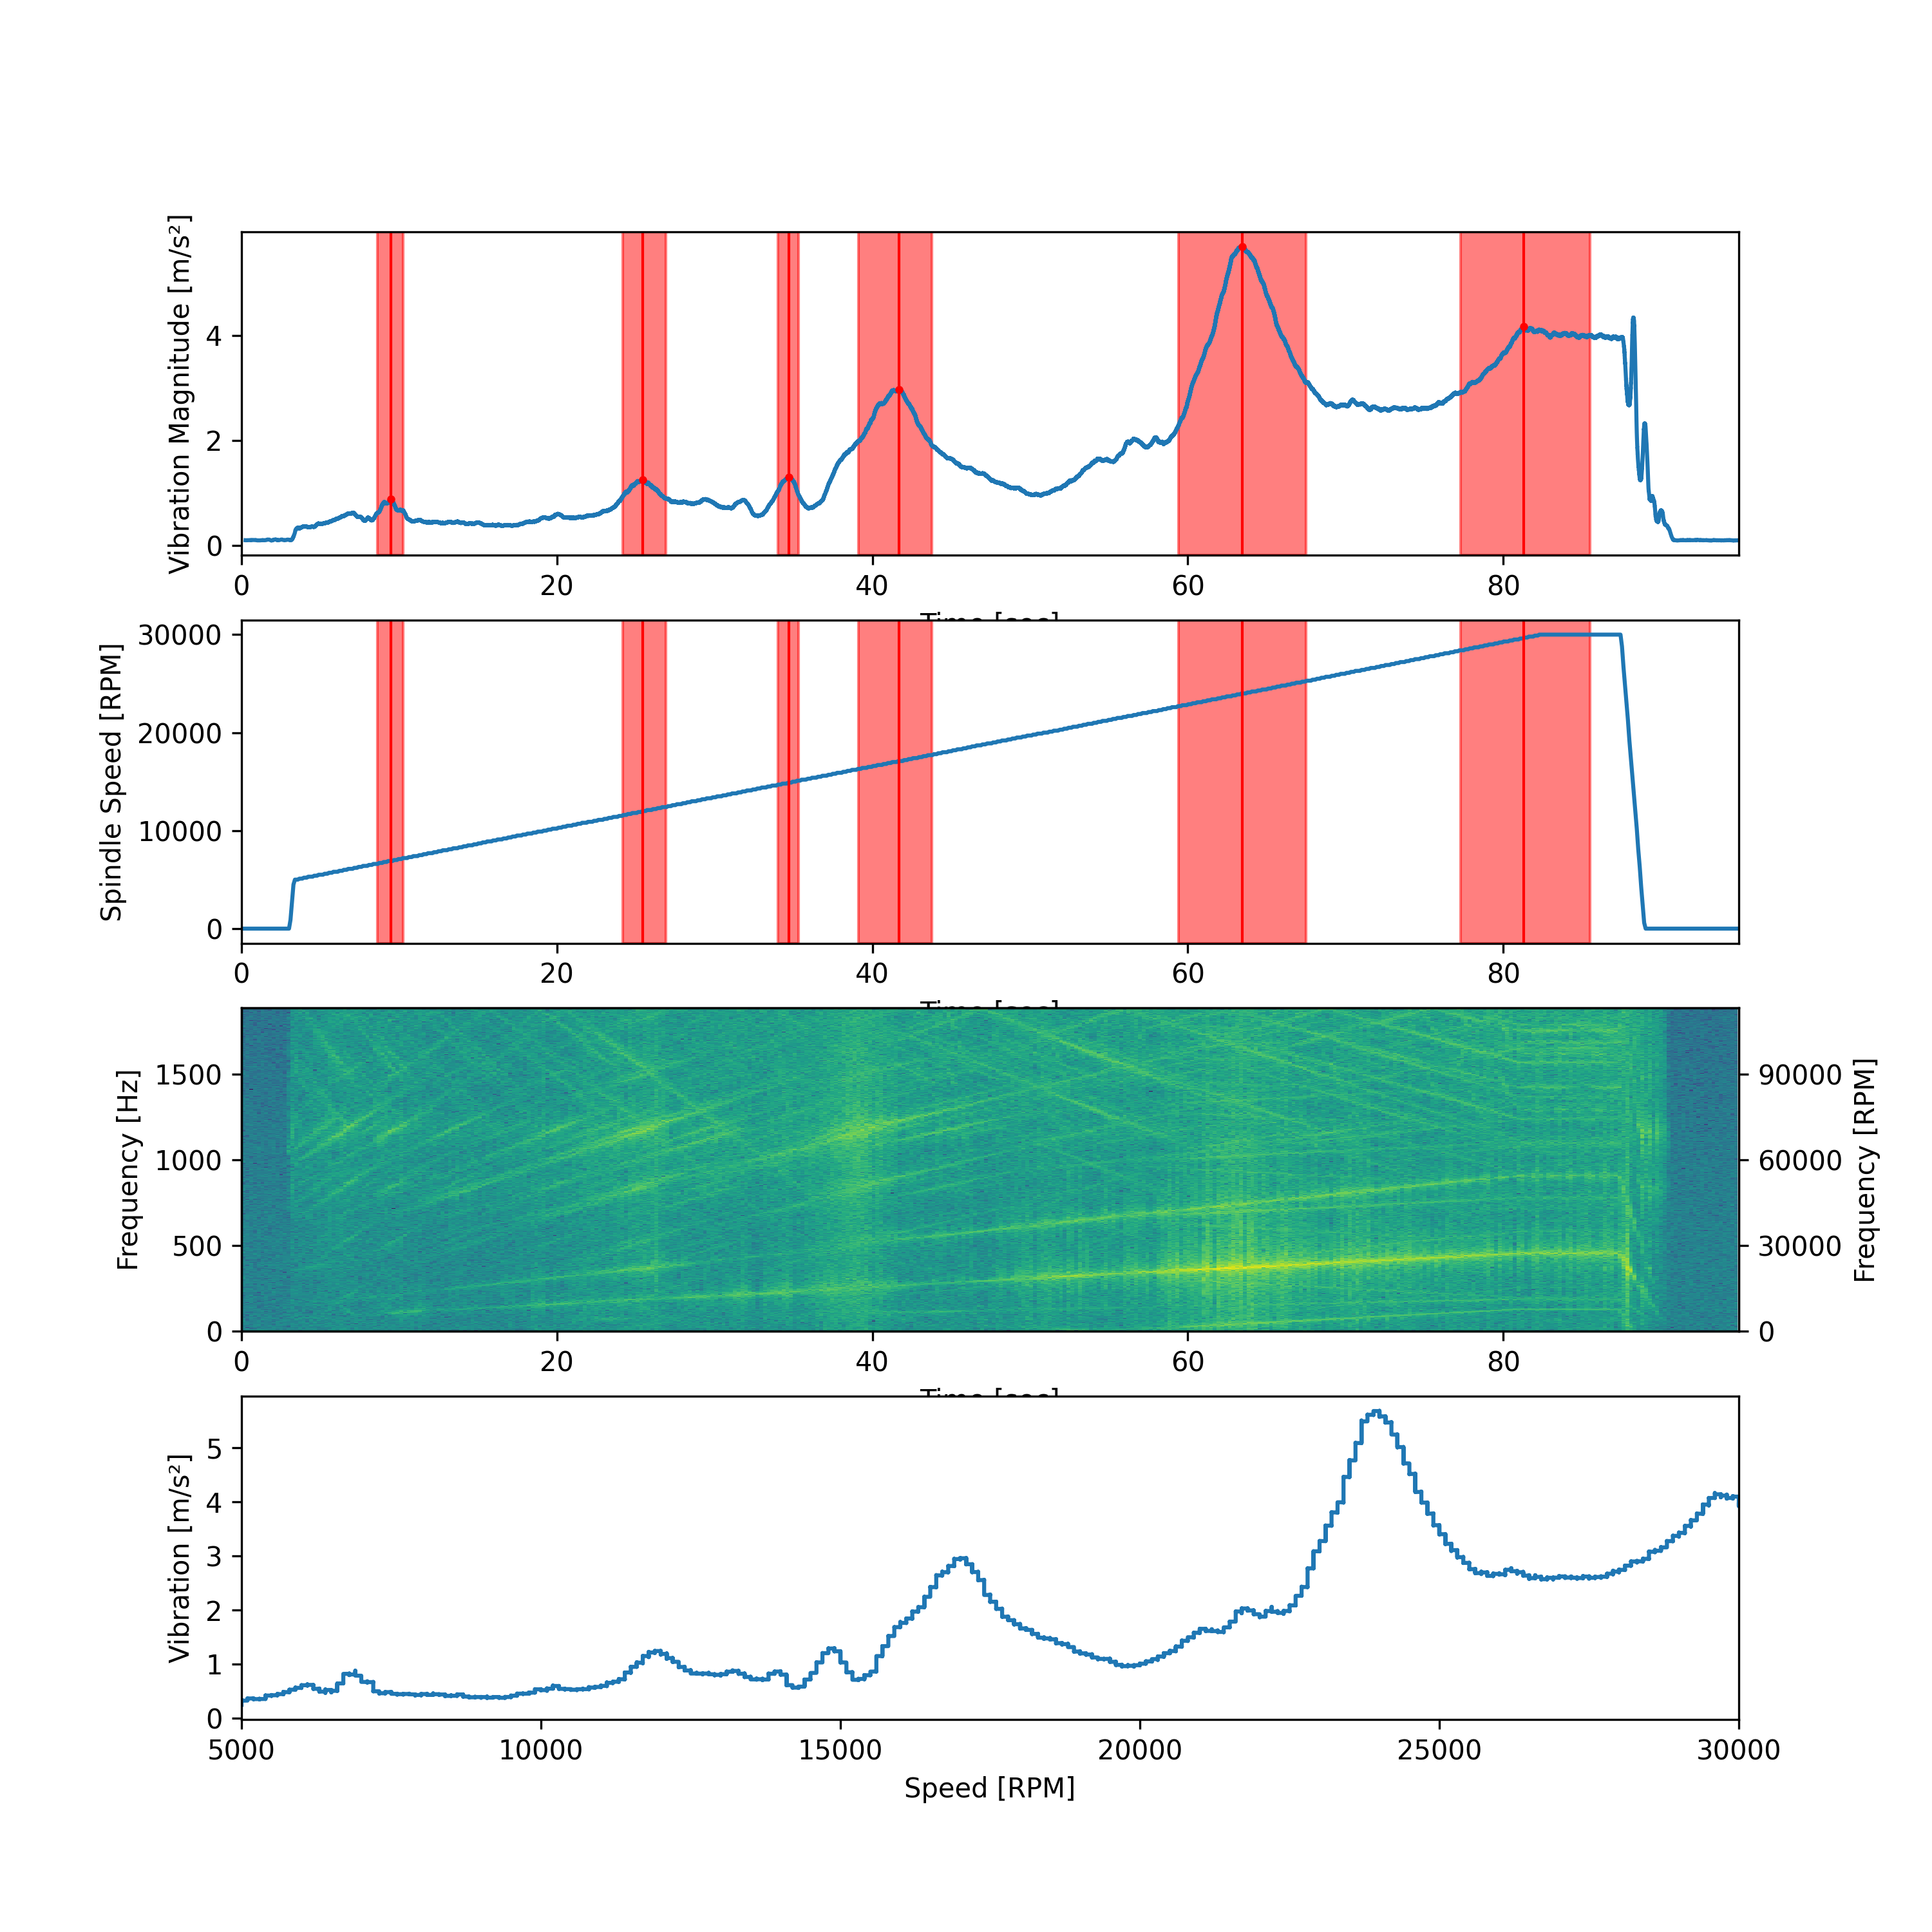
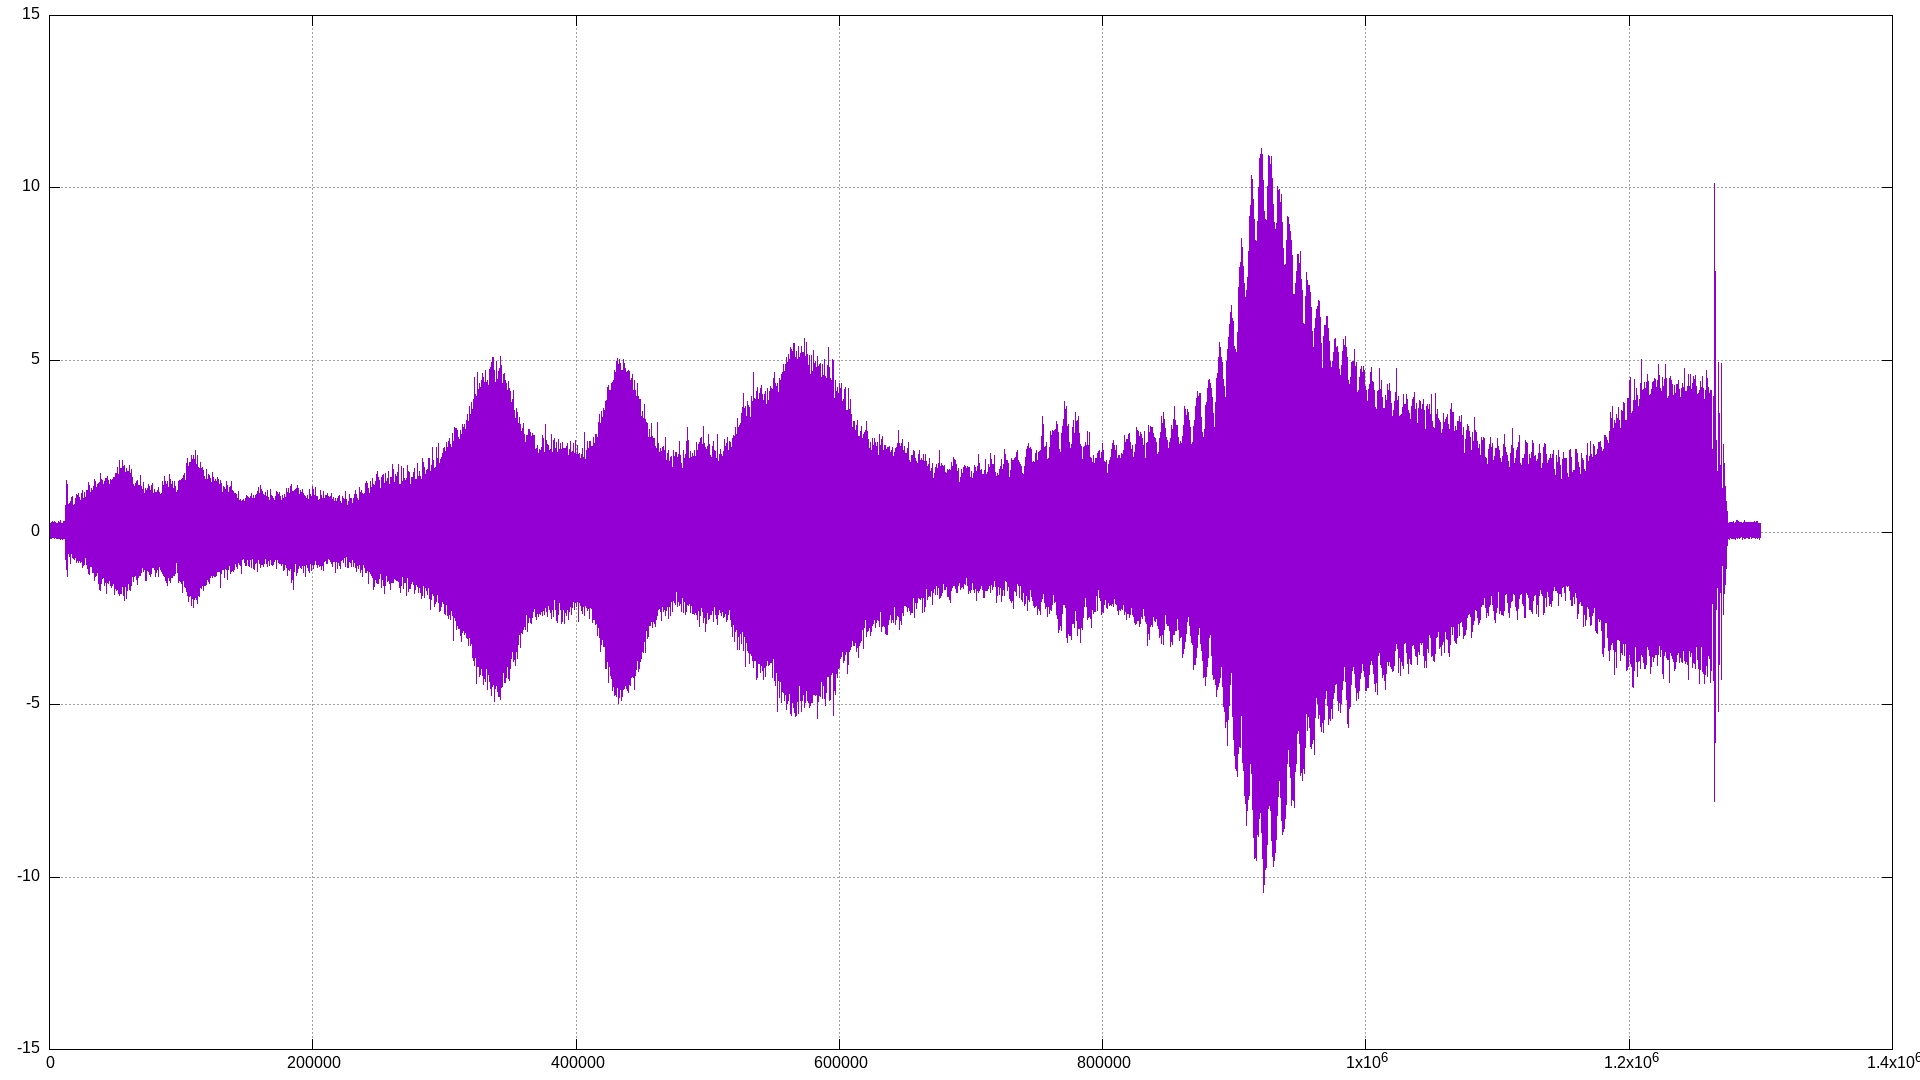
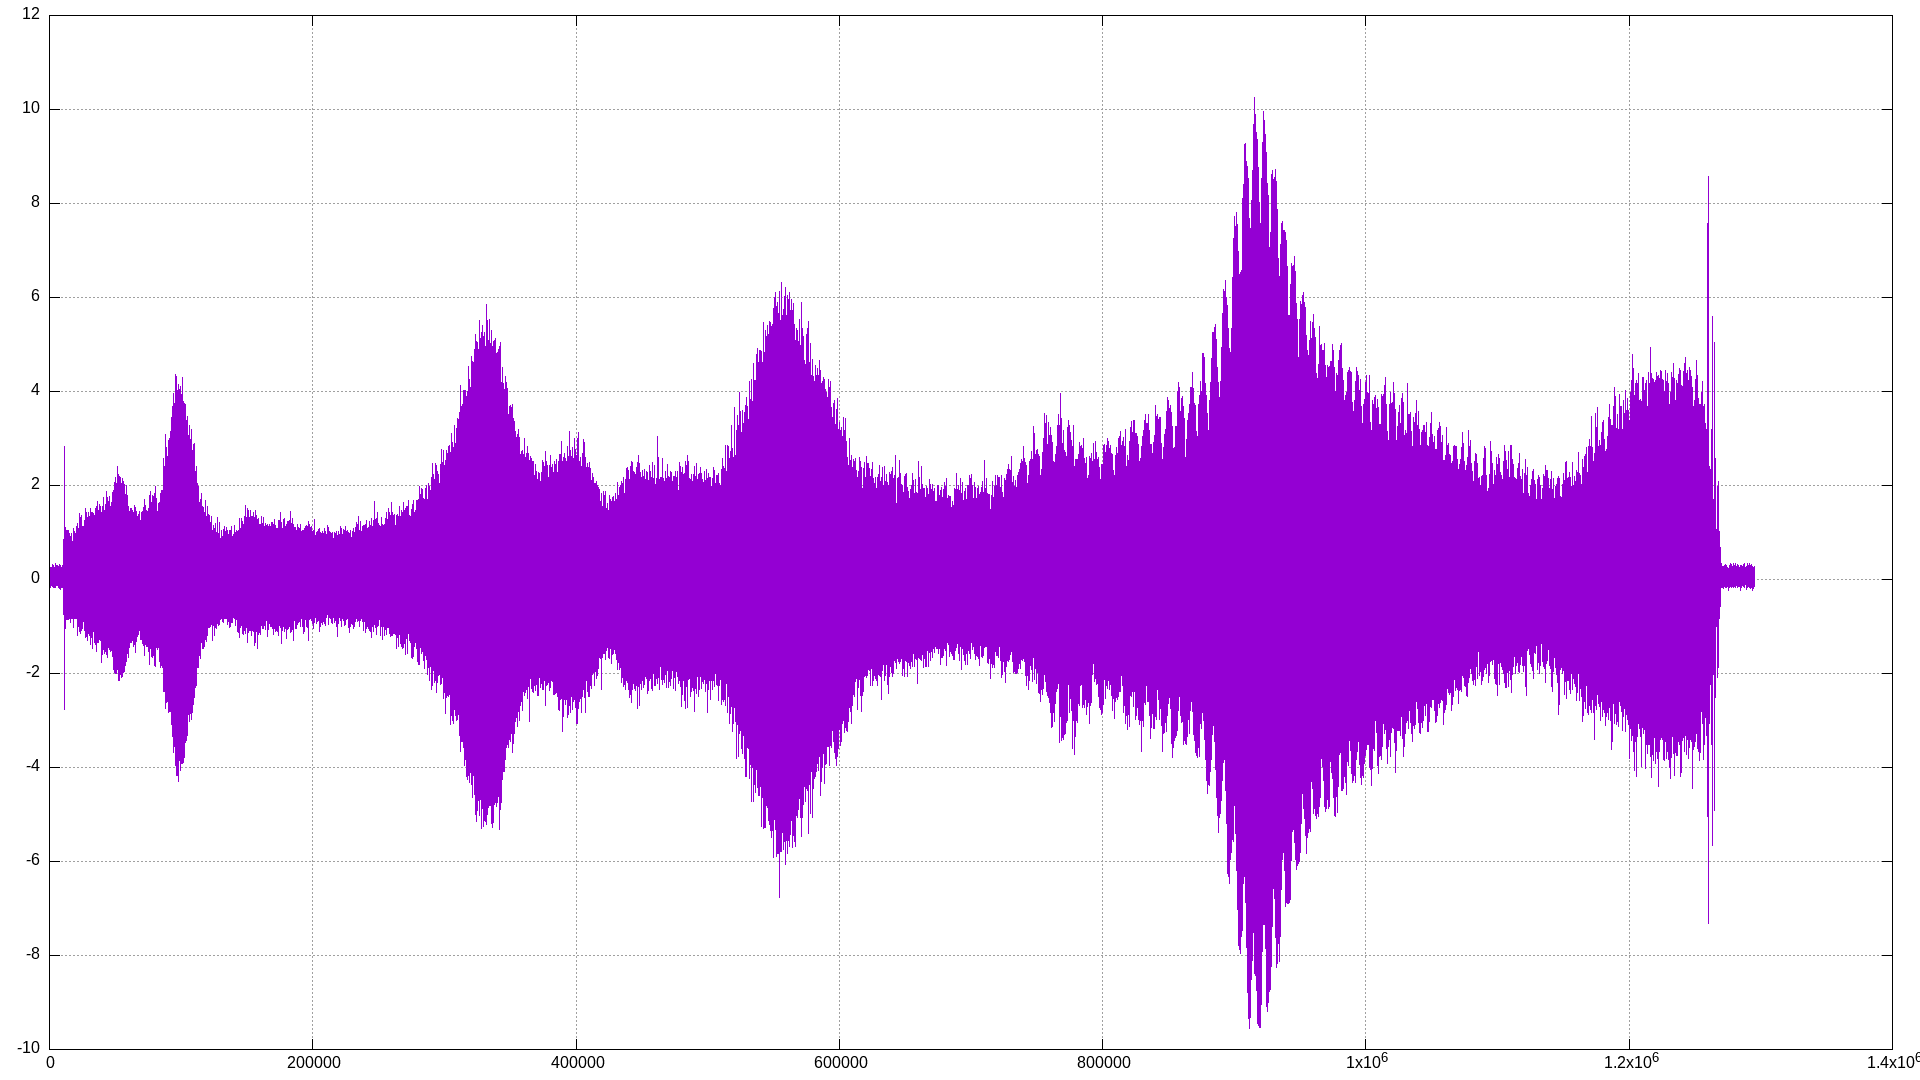
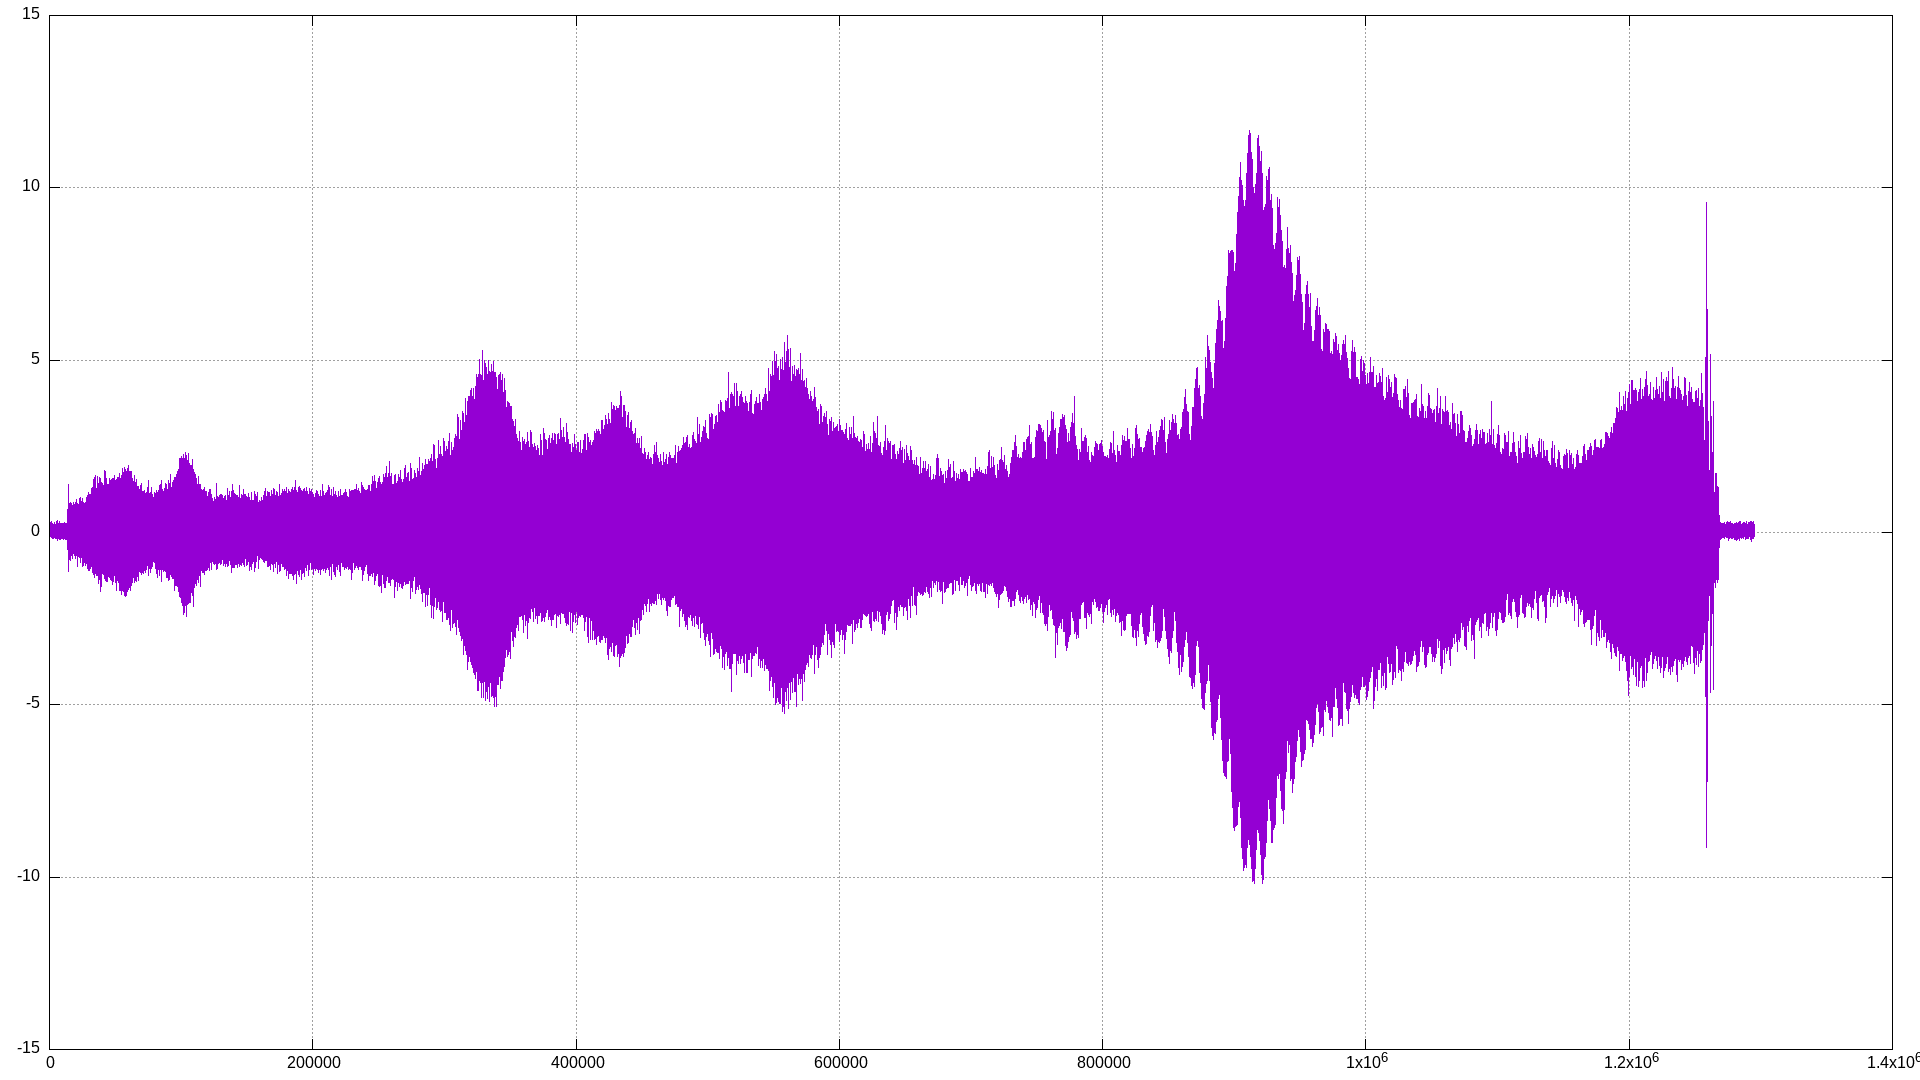
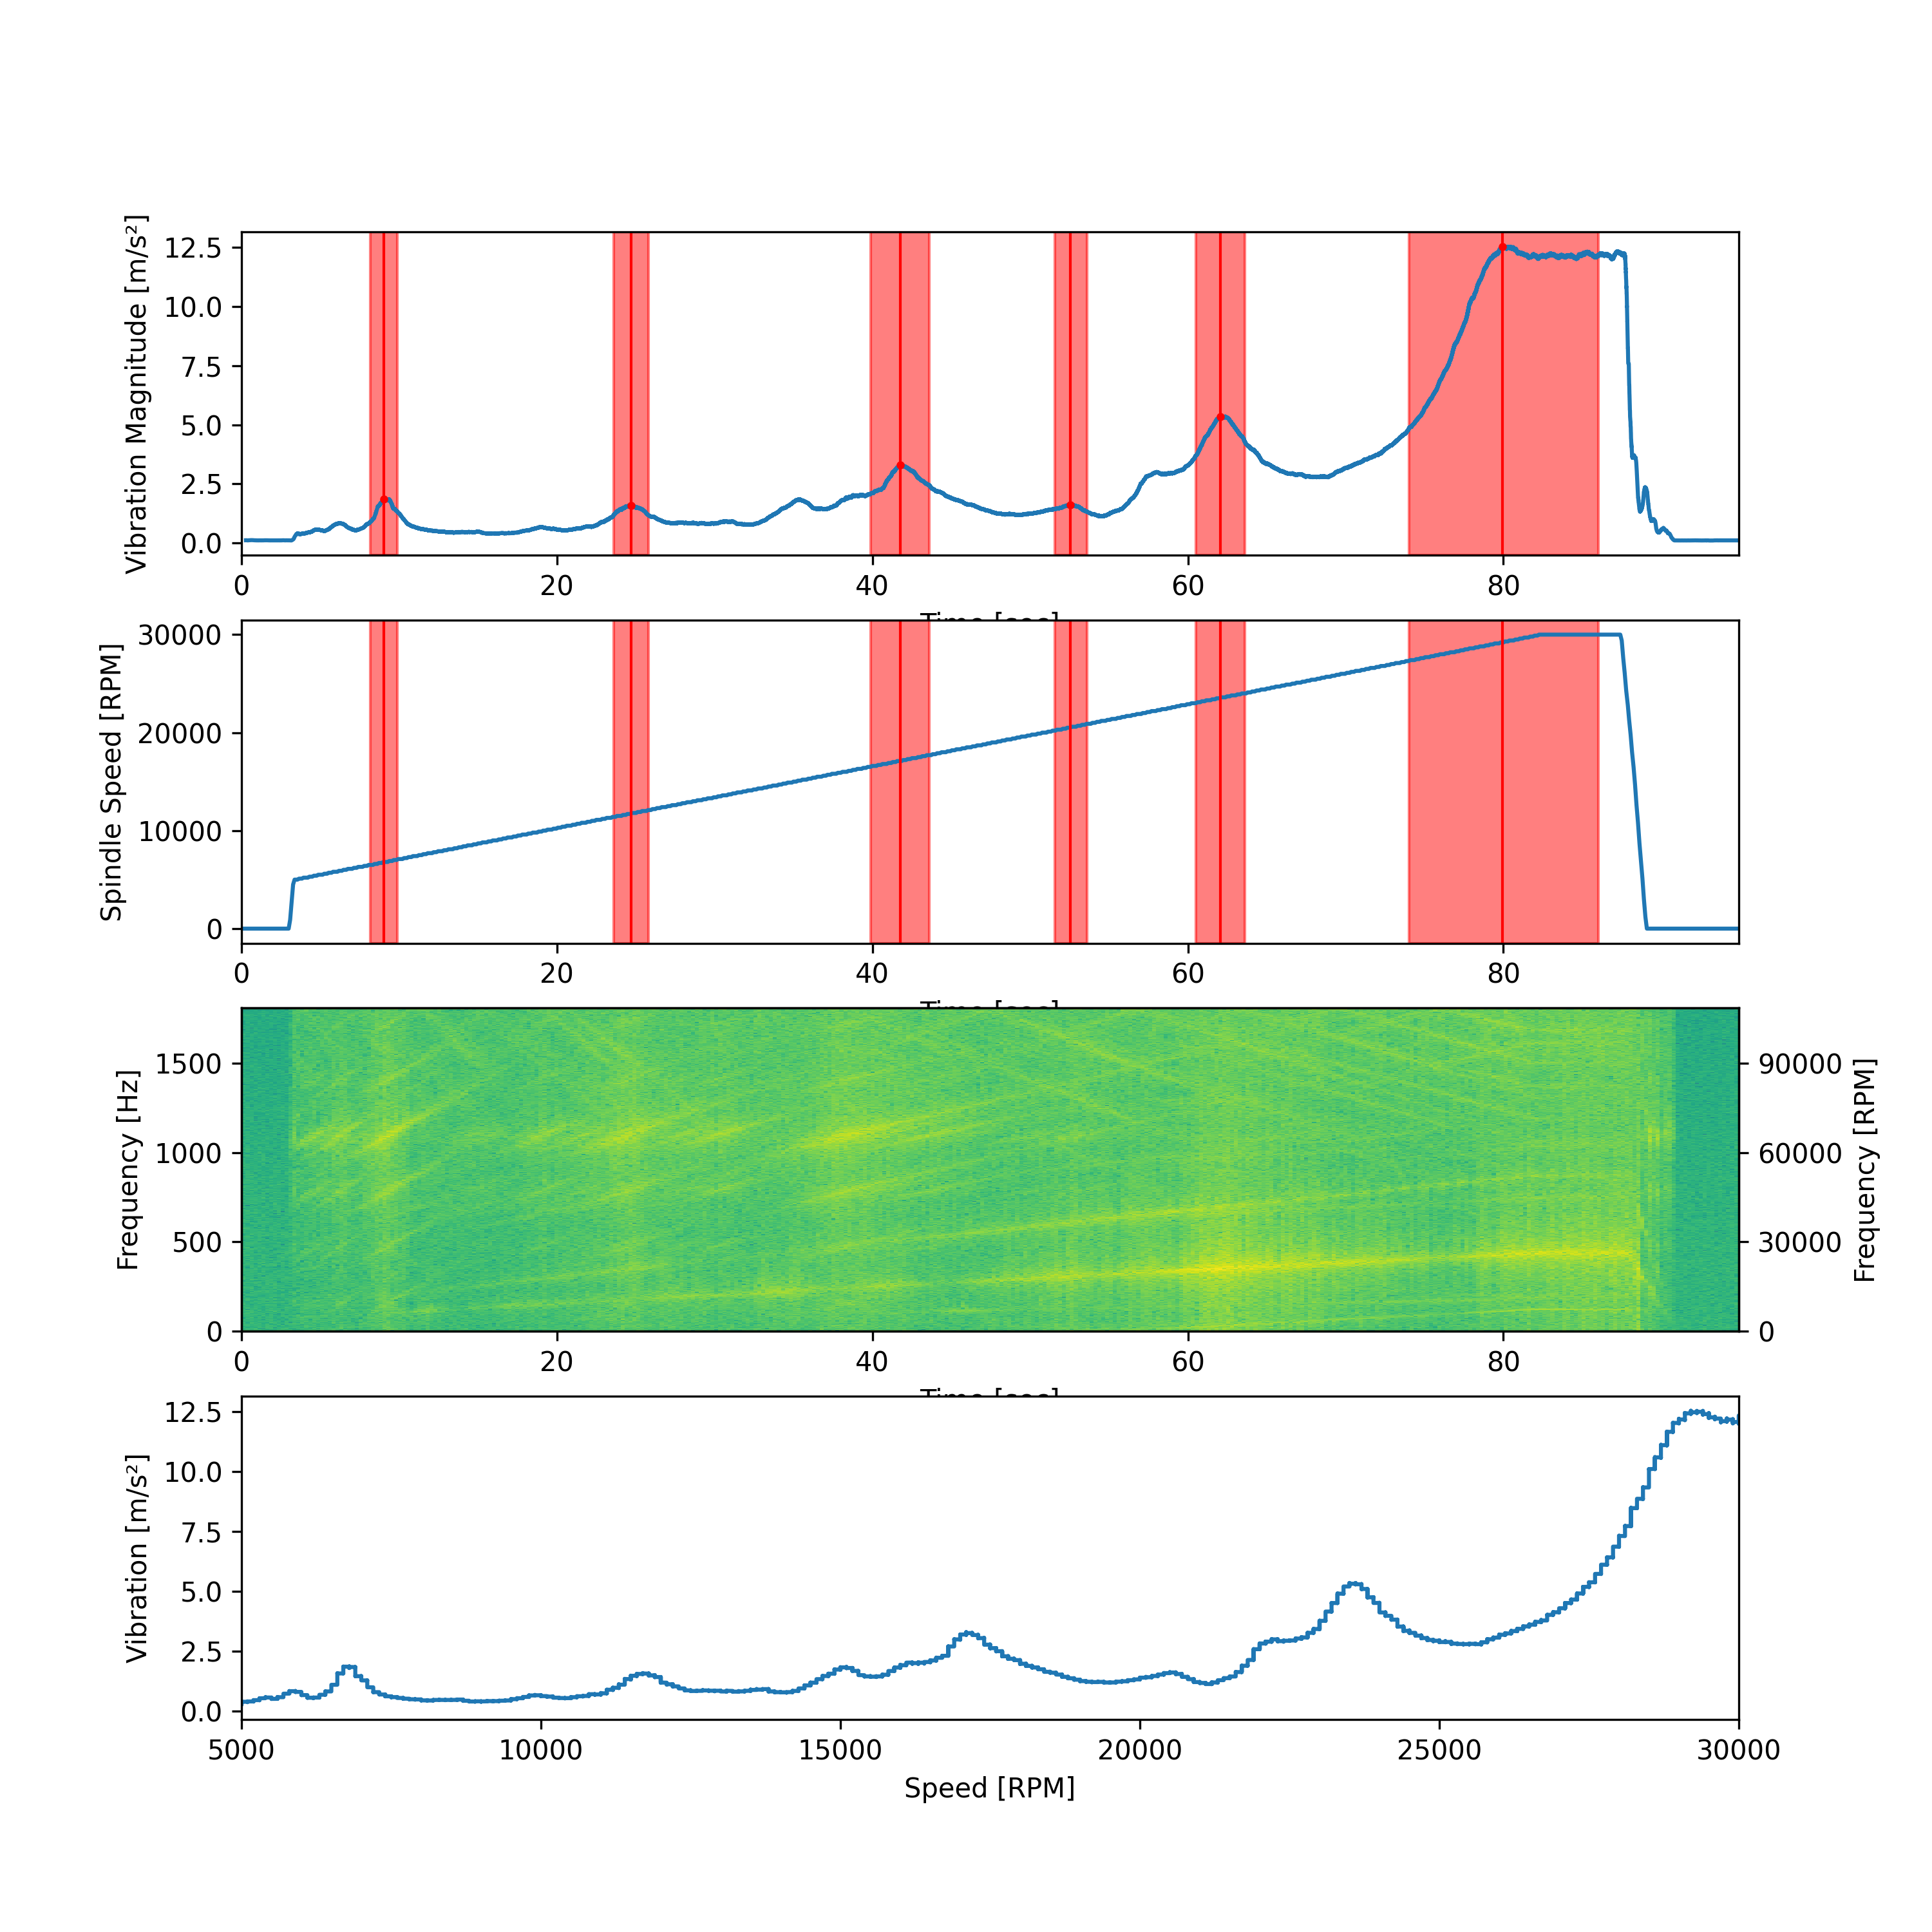
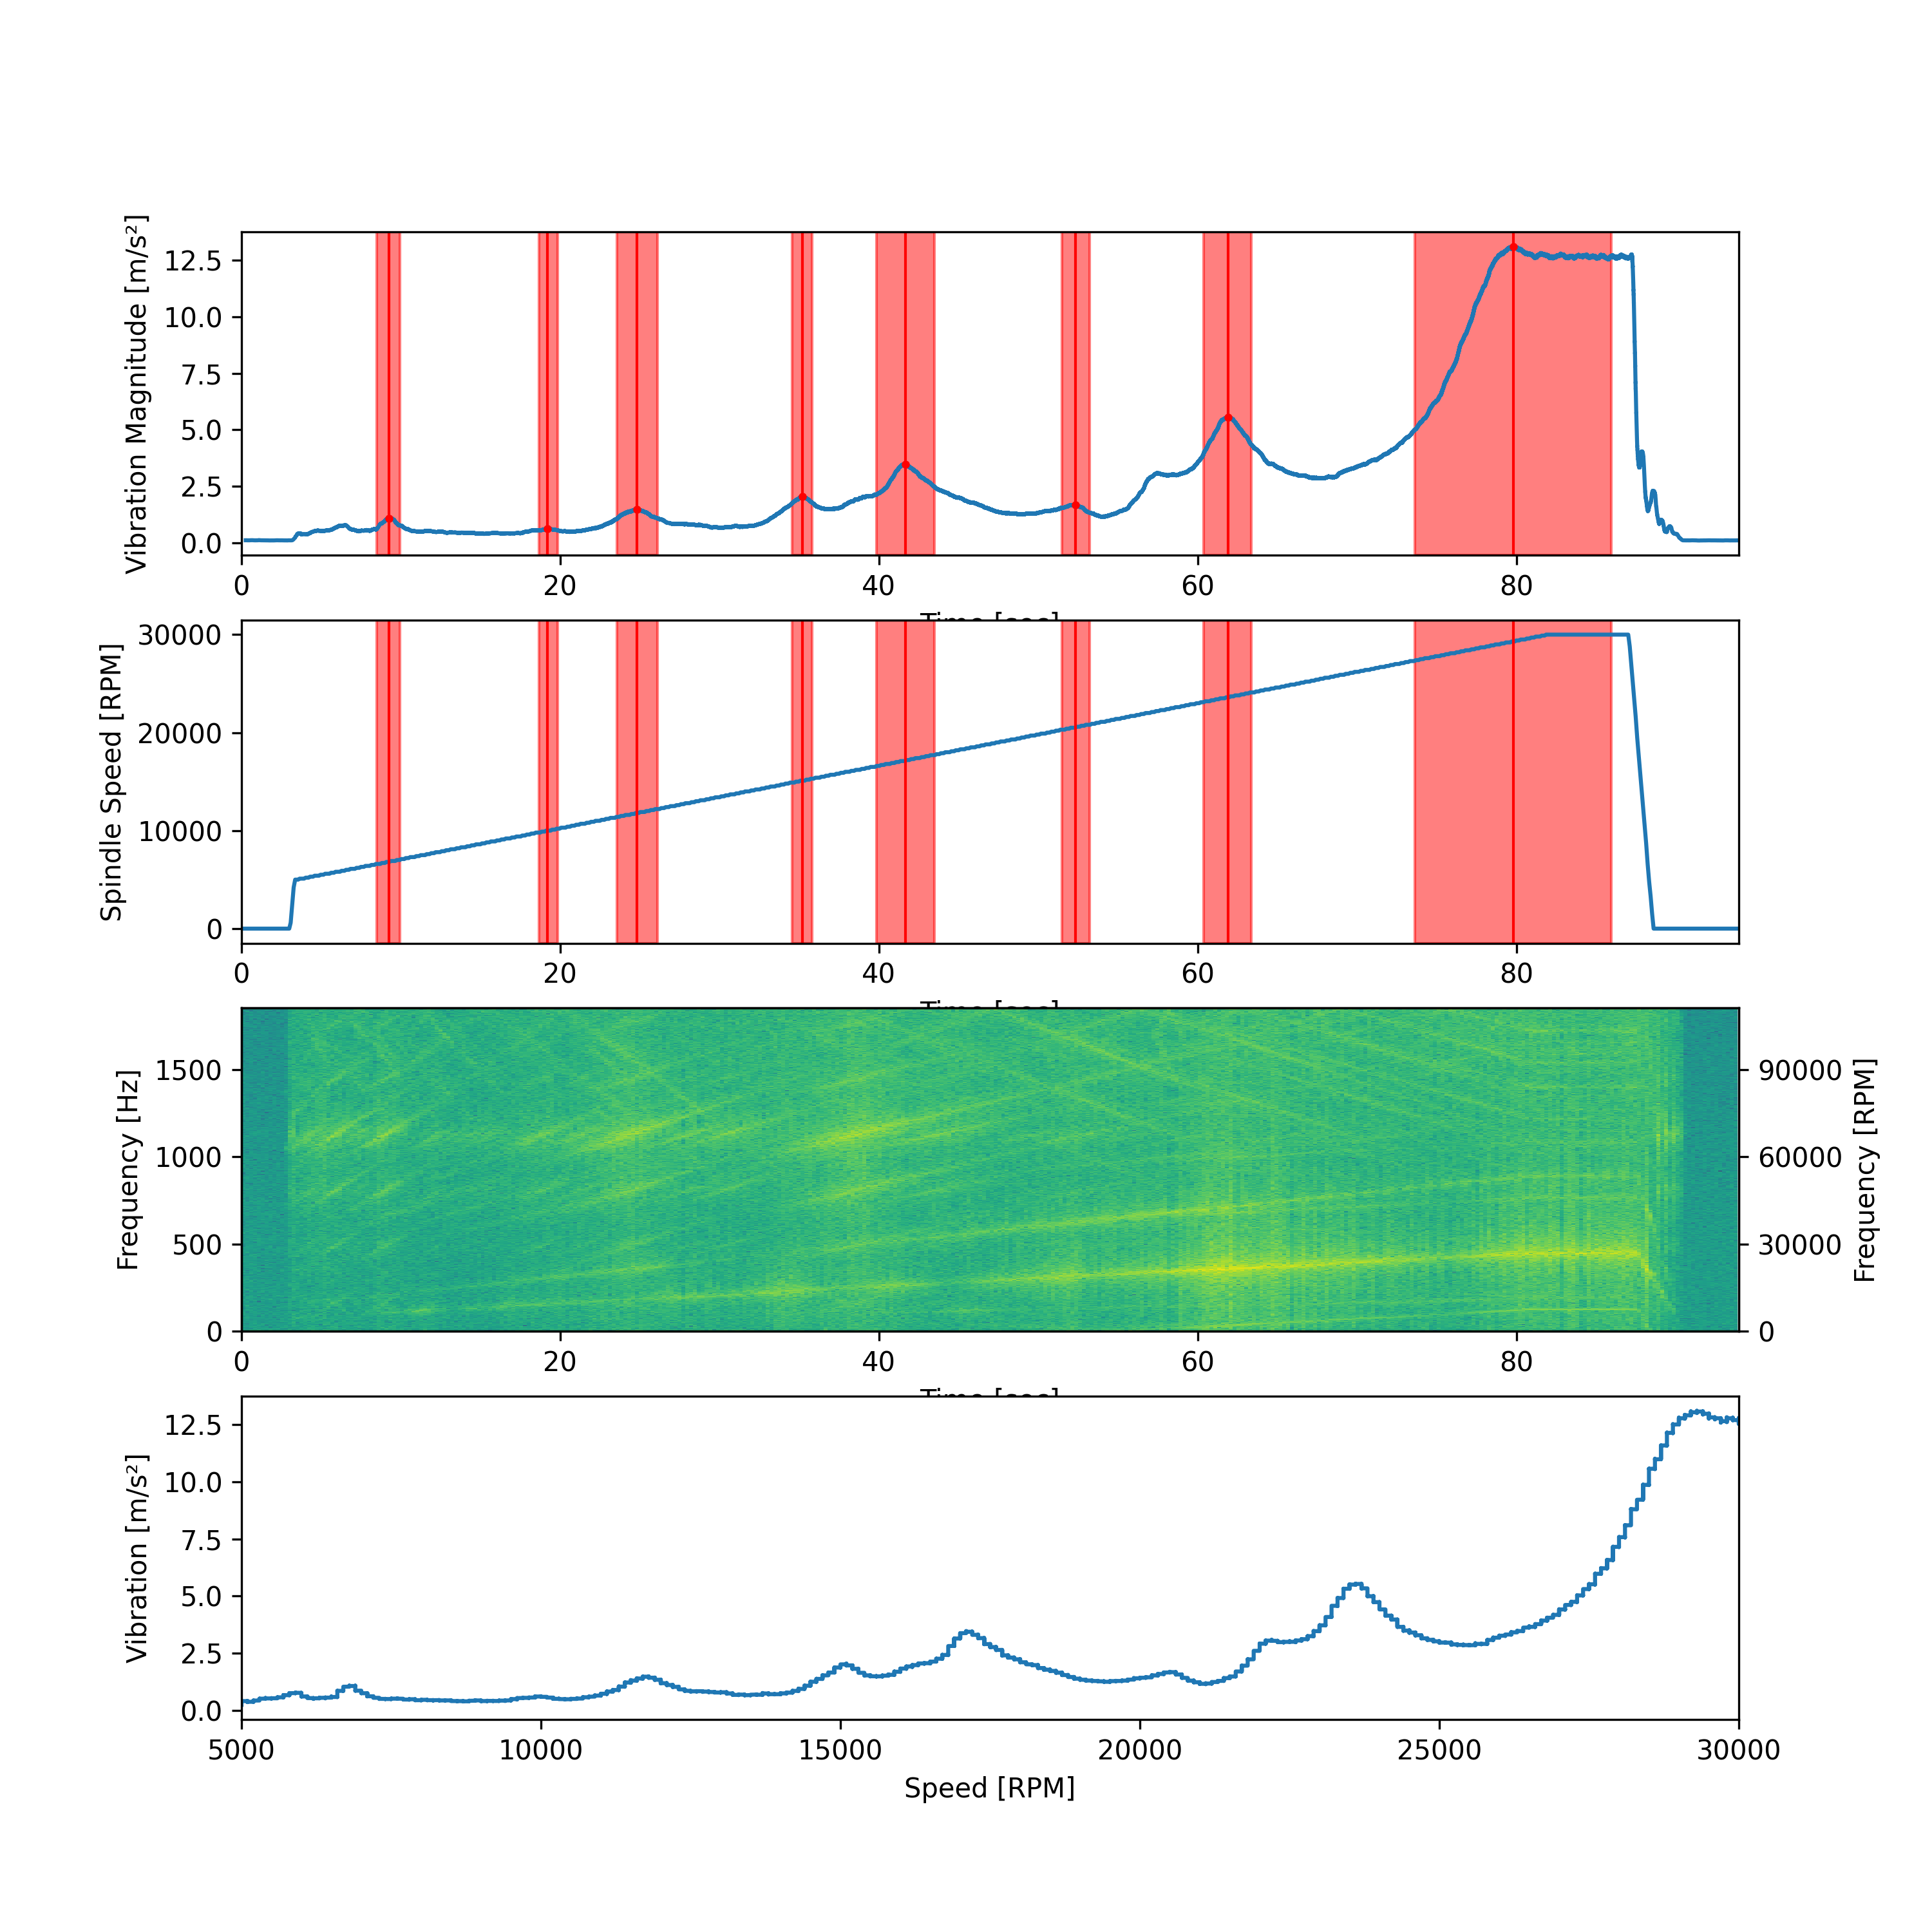
Once I recorded the data, I was mainly interested in how strong the vibrations were over time, so I just plotted them into a kind of waveform.

Here’s the waveform data with an empty collet:

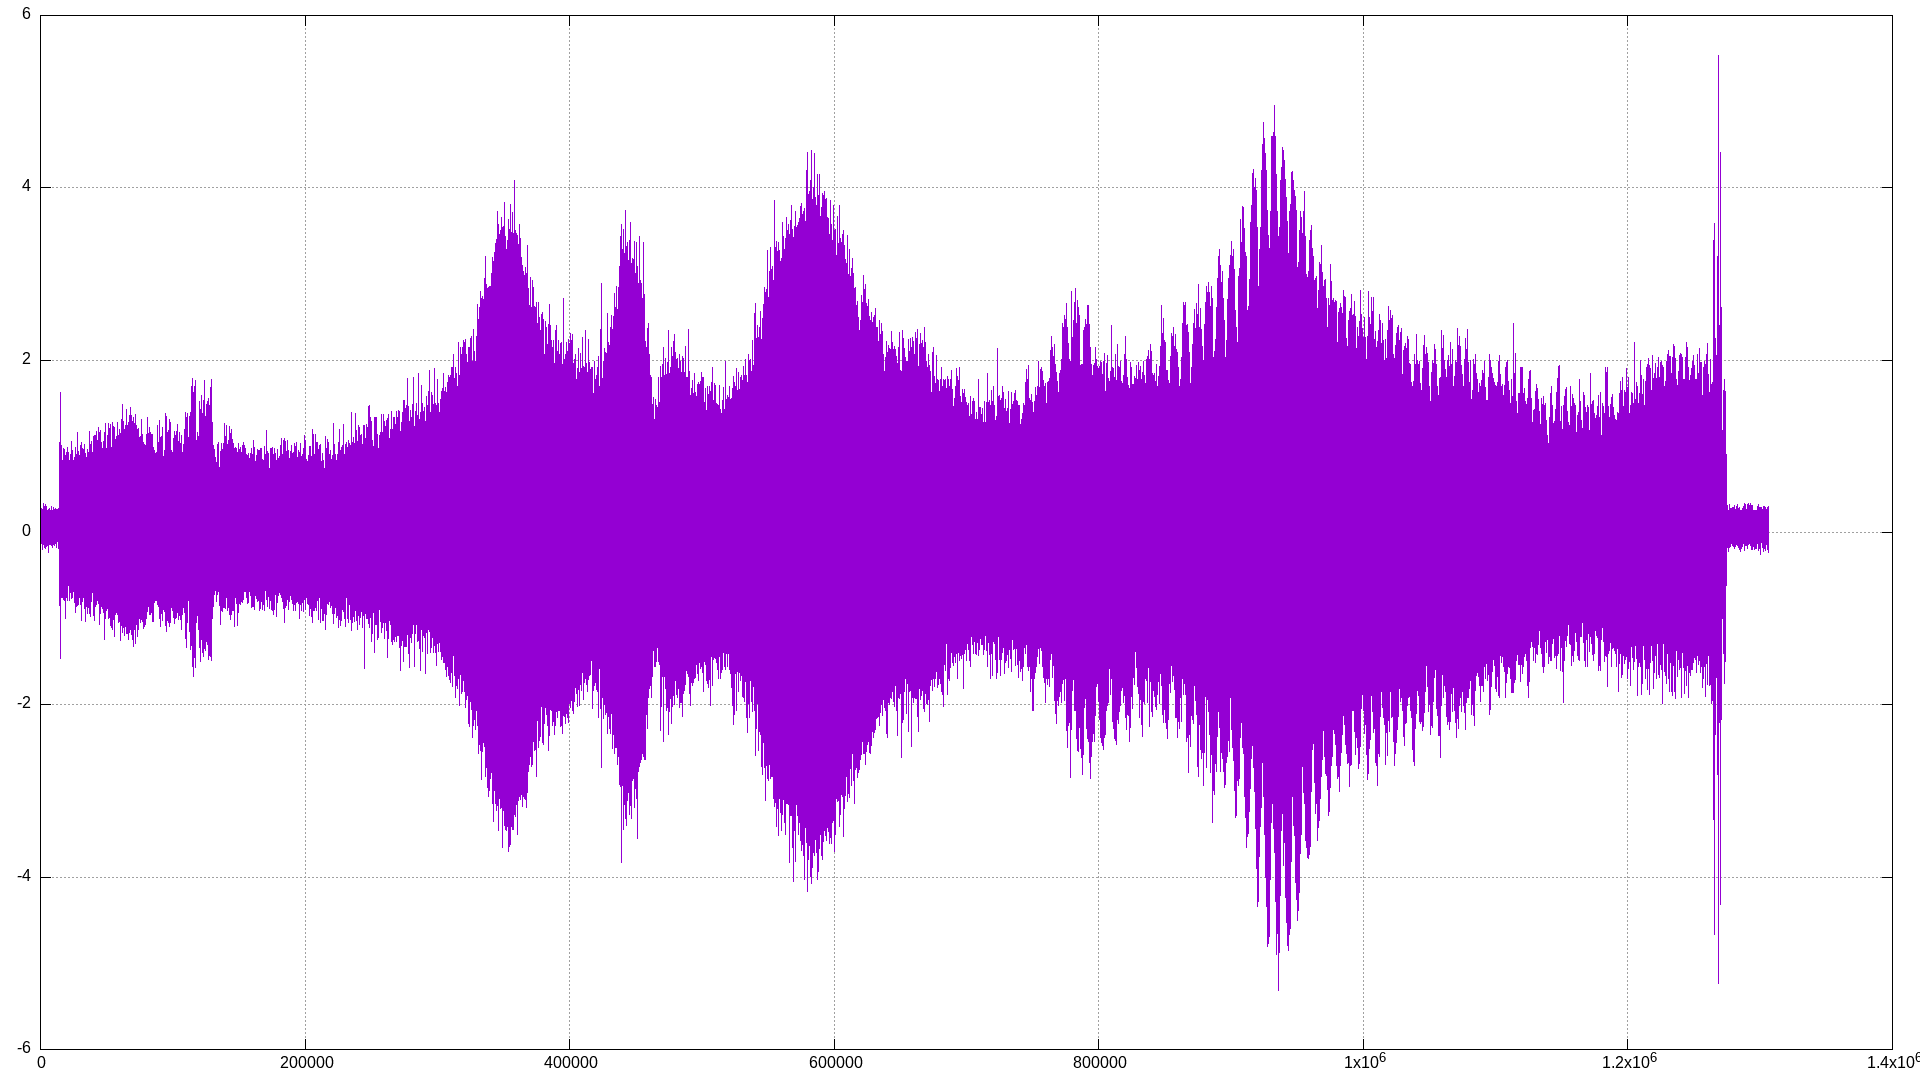
Everything else should be looked at relative to this.

The waveforms I’m using show acceleration in m/s² on the Y-axis and sample number on the X-axis. There should be ~4120 samples per second. The spindle ramps up from 5k to 30k so the far left of the chart is 5k RPM and the far right is 30k RPM.

Does the collet make a difference?

I ran the following tests:

Shank diameter Collet Endmill Waveform
3mm GERC11-HP DIXI Polytool sampledata_speedramp_GERC11-HP_3,0_dixi
3mm 3.5mm GERC11-B DIXI Polytool sampledata_speedramp_GERC11-B_3,5_dixi
1/8" Probably Carbide3D CNCFraises FC1DA3012 sampledata_speedramp_NomadNut_0,125in_cncfraisesFC1DA3012
1/8" CNCFraises CNCFraises FC1DA3012 sampledata_speedramp_CncFraises_0,125in_cncfraisesFC1DA3012
1/8" 3.5mm GERC11-B CNCFraises FC1DA3012 sampledata_speedramp_GERC11-B_3,5_cncfraisesFC1DA3012
1/8" 3.5mm REGOFIX UP CNCFraises FC1DA3012 sampledata_speedramp_REGOFIX-ER11UP_3,5_cncfraisesFC1DA3012
6mm Sorotec Sumitomo ASM2060DL sampledata_speedramp_Sorotec_6,0_ASM2060DL
6mm GERC11-B Sumitomo ASM2060DL sampledata_speedramp_GERC11-B_6,0_ASM2060DL
6mm GERC11-HP Sumitomo ASM2060DL sampledata_speedramp_GERC11-HP_6,0_ASM2060DL

The spindle is held at 30k RPM for 5s at the very end which is why you see one largely flat blob there.

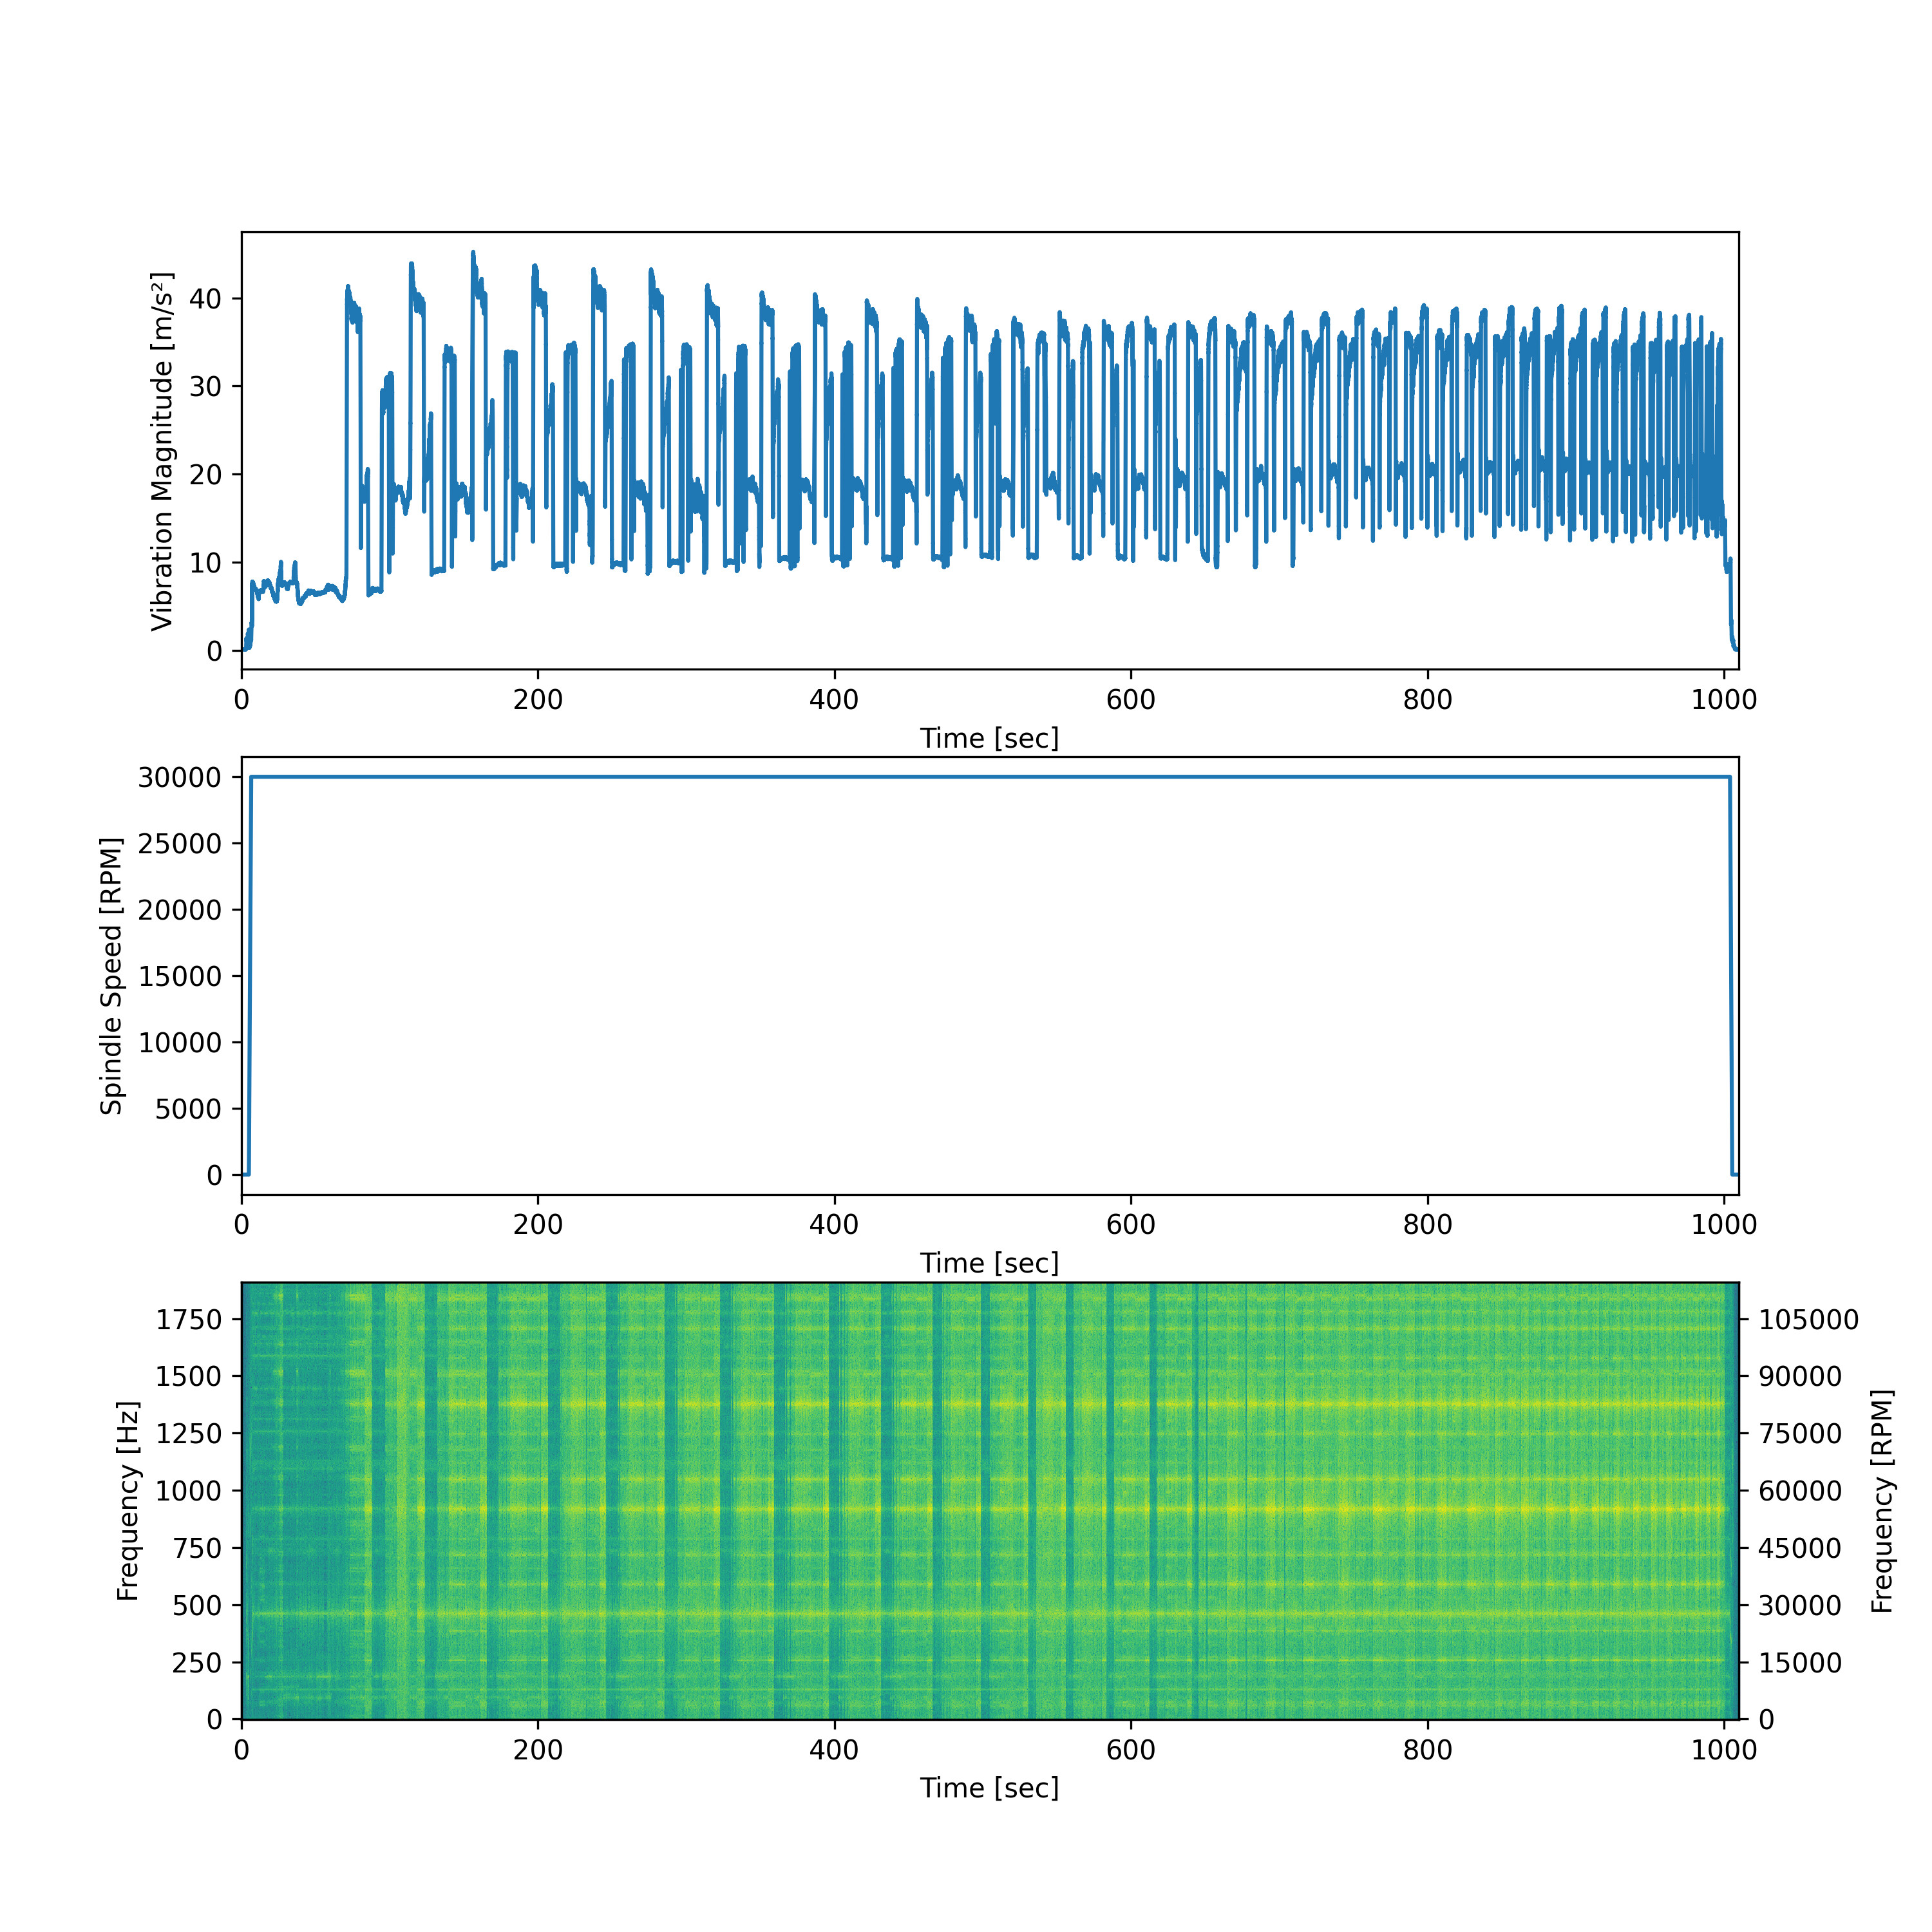
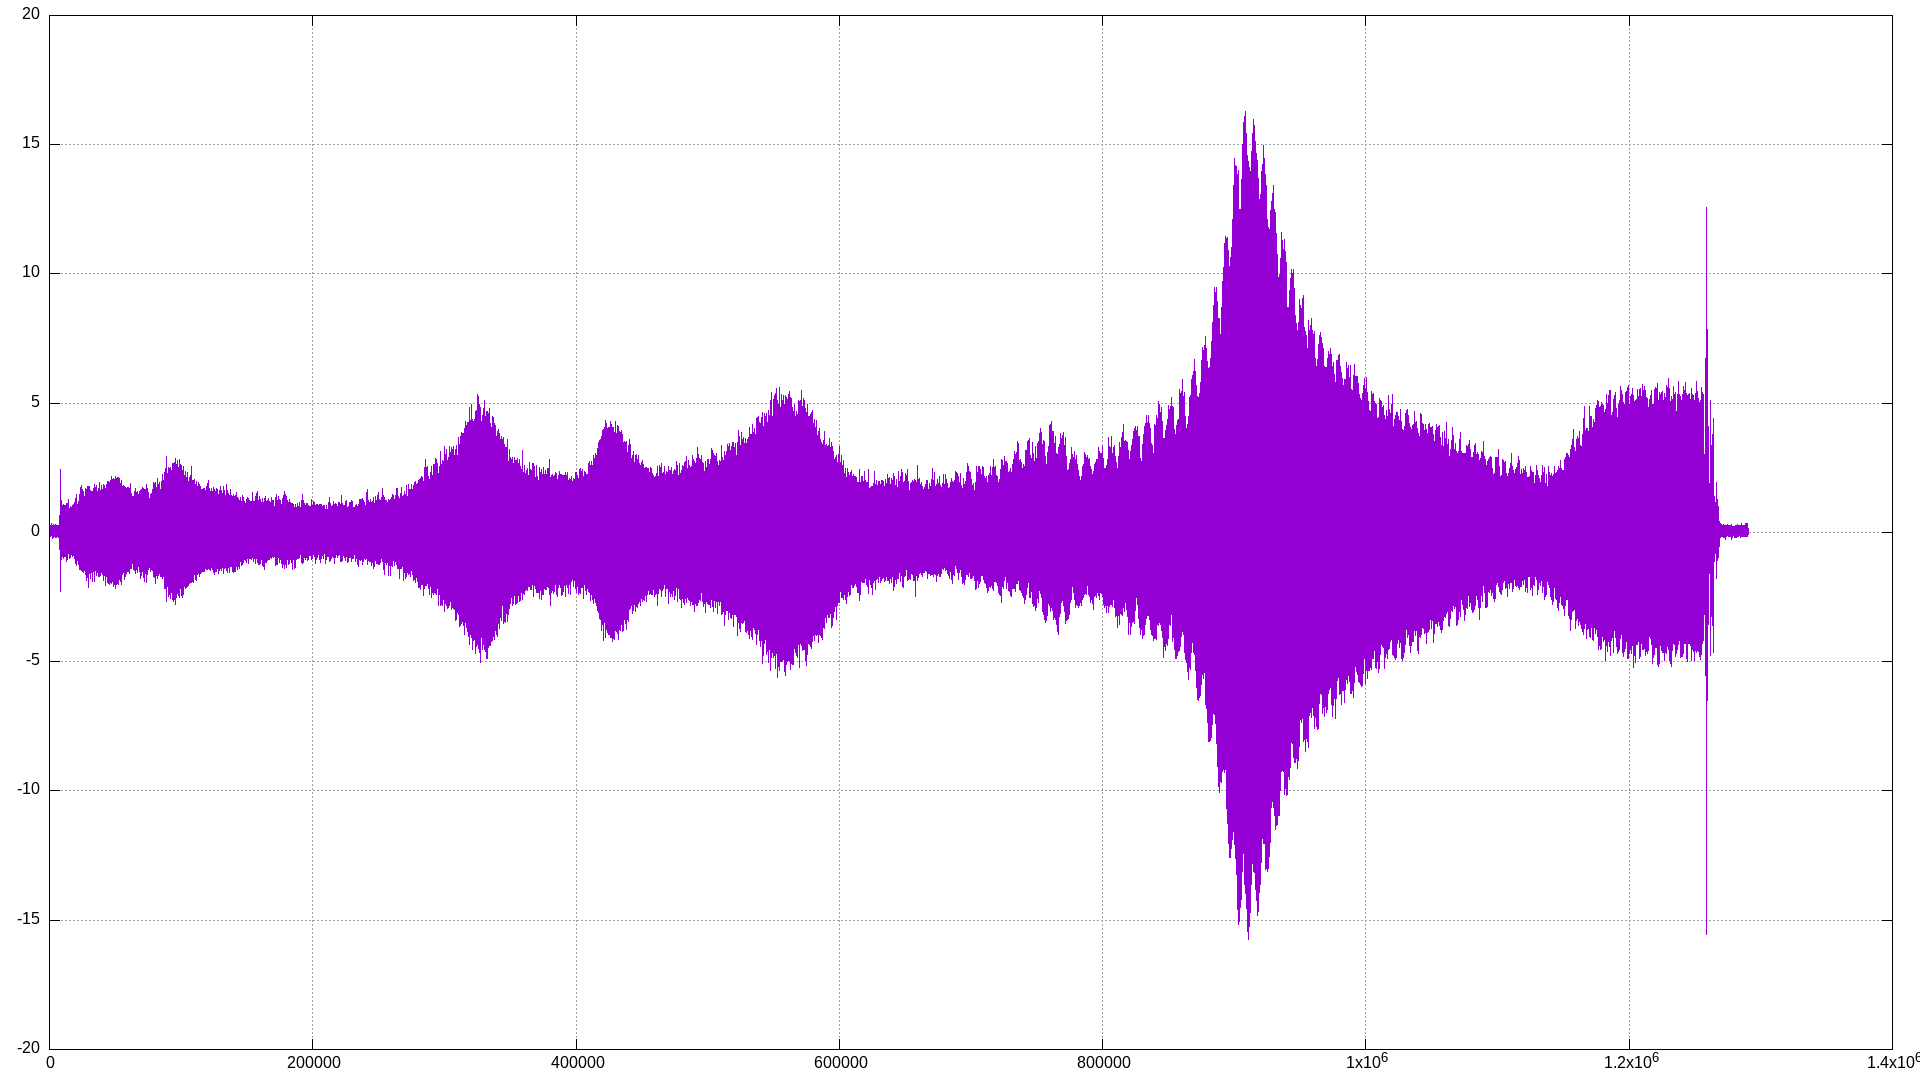
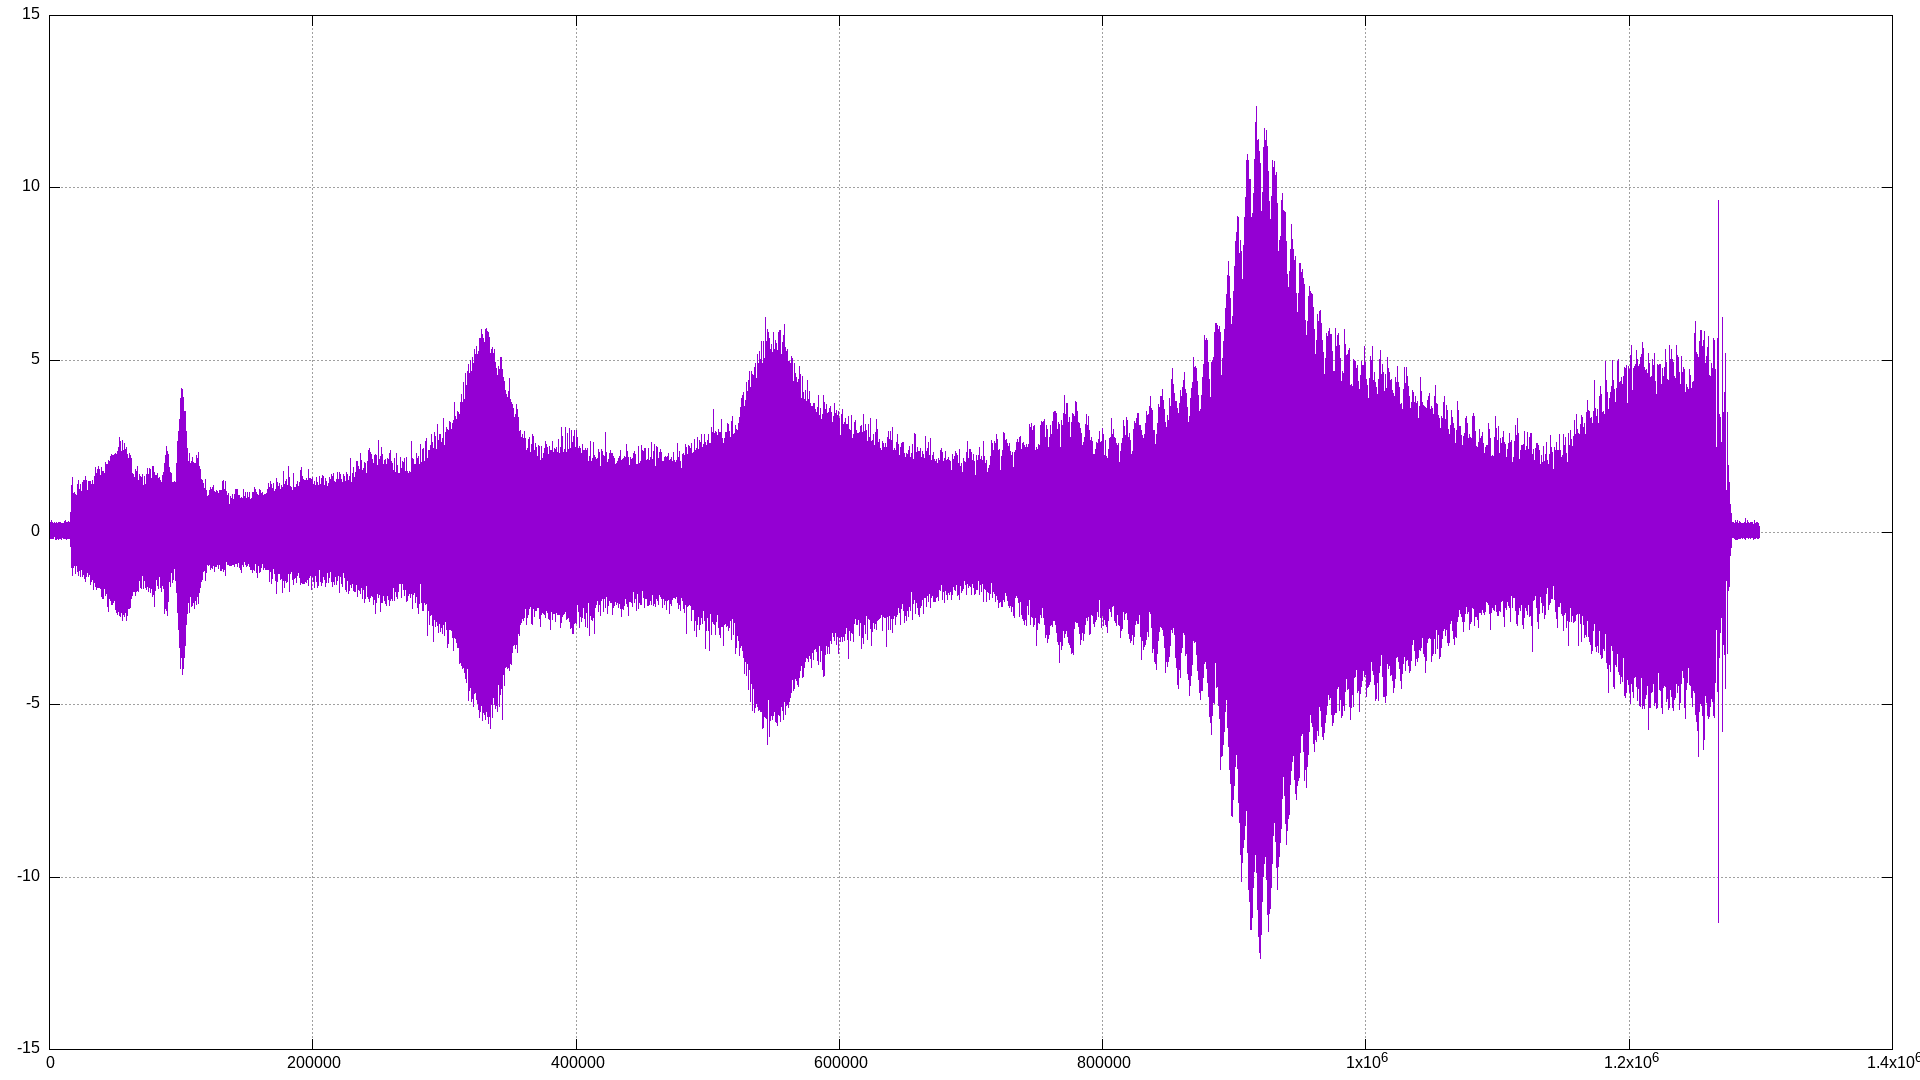
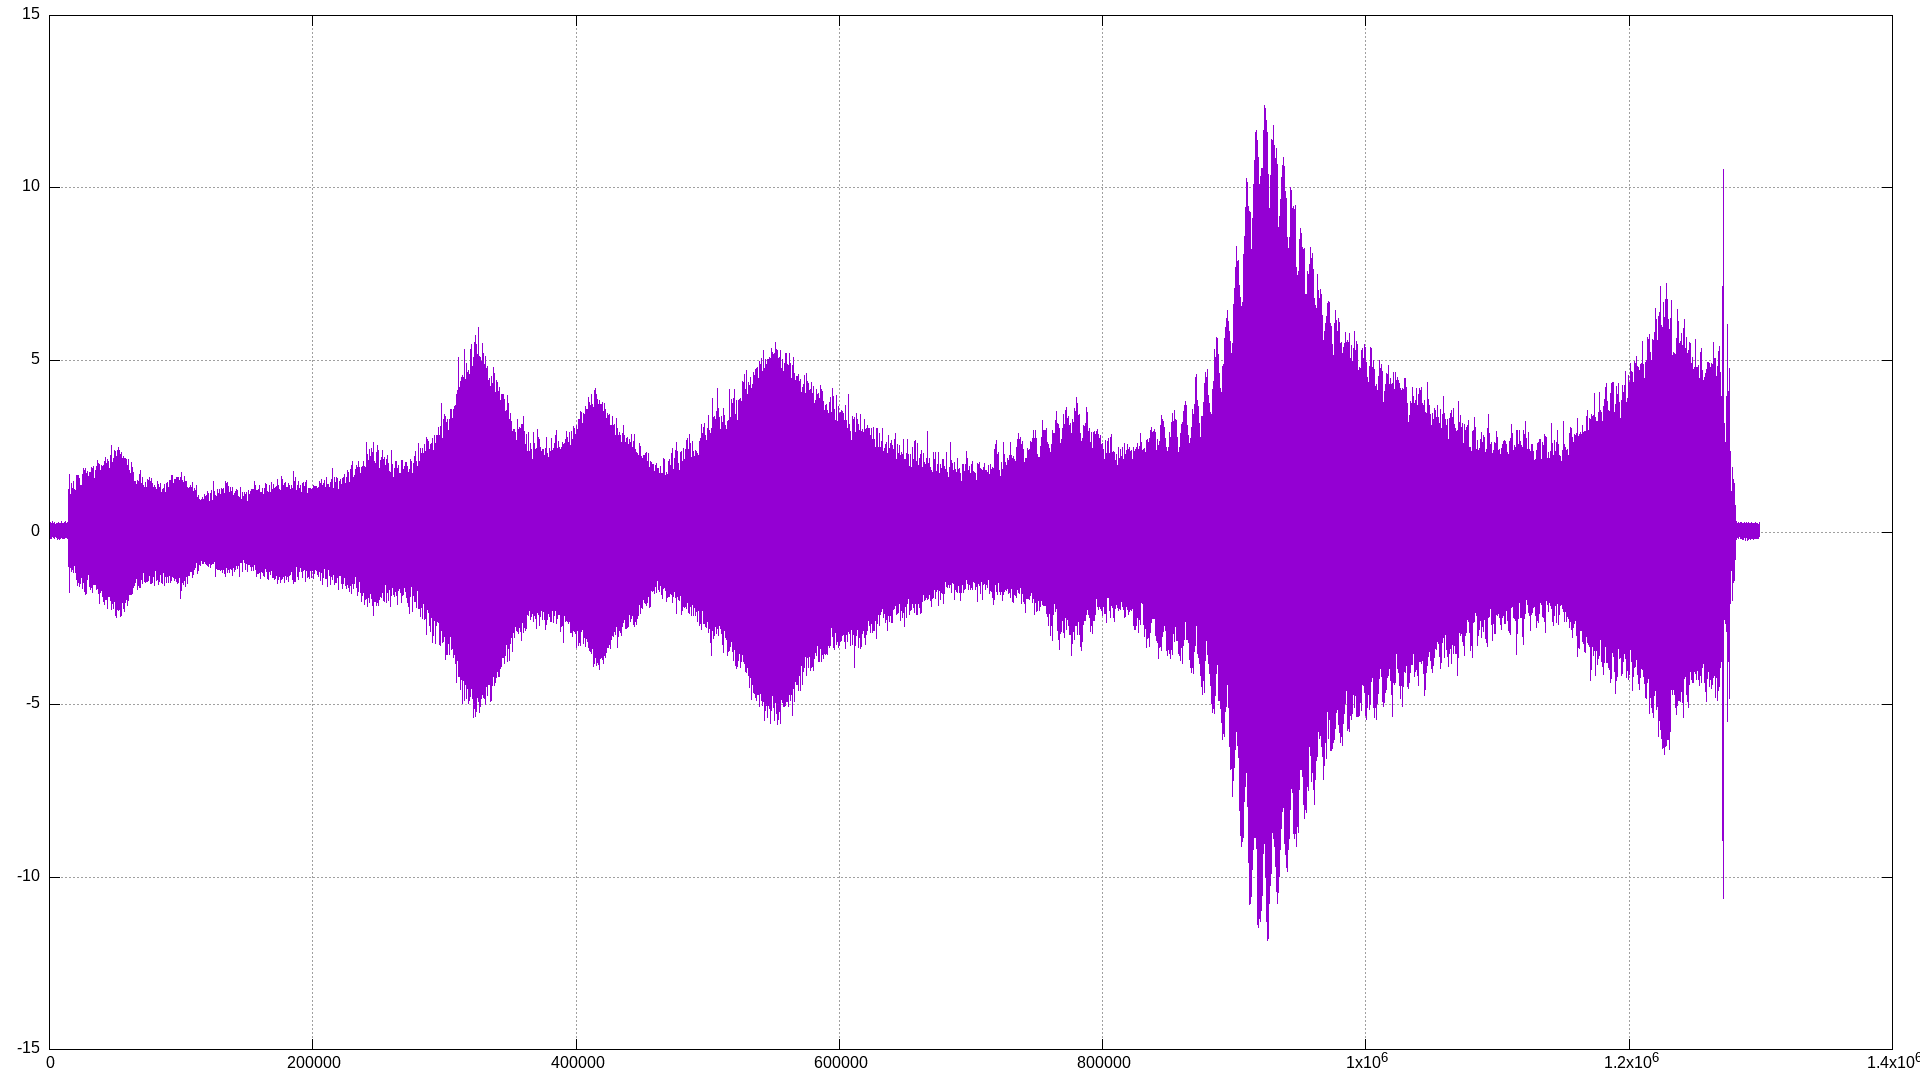
Conclusion: Yes, the collet absolutely makes a difference. If you compare the files for the 1/8" endmill, you can see:

  • The “Probably Carbide3D” collet has a maximum amplitude of only ~10m/s², while the others are mostly around 15m/s². This is relative to a peak of ~4m/s² with an empty collet.
  • They all show peaks in similar areas but the REGOFIX and Cncfraises collets both have a peak around 400000 on the X-axis, while the other two collets do not.

How big these differences are in practice, I have no clue.

Does the tool length make a difference?

Shank diameter Collet Endmill Waveform
1/8" 3.5mm GERC11-B CNCFraises FC1DA3008 (8mm) sampledata_speedramp_GERC11-B_3,5_cncfraisesFC1DA3008
1/8" 3.5mm GERC11-B CNCFraises FC1DA3012 (12mm) sampledata_speedramp_GERC11-B_3,5_cncfraisesFC1DA3012

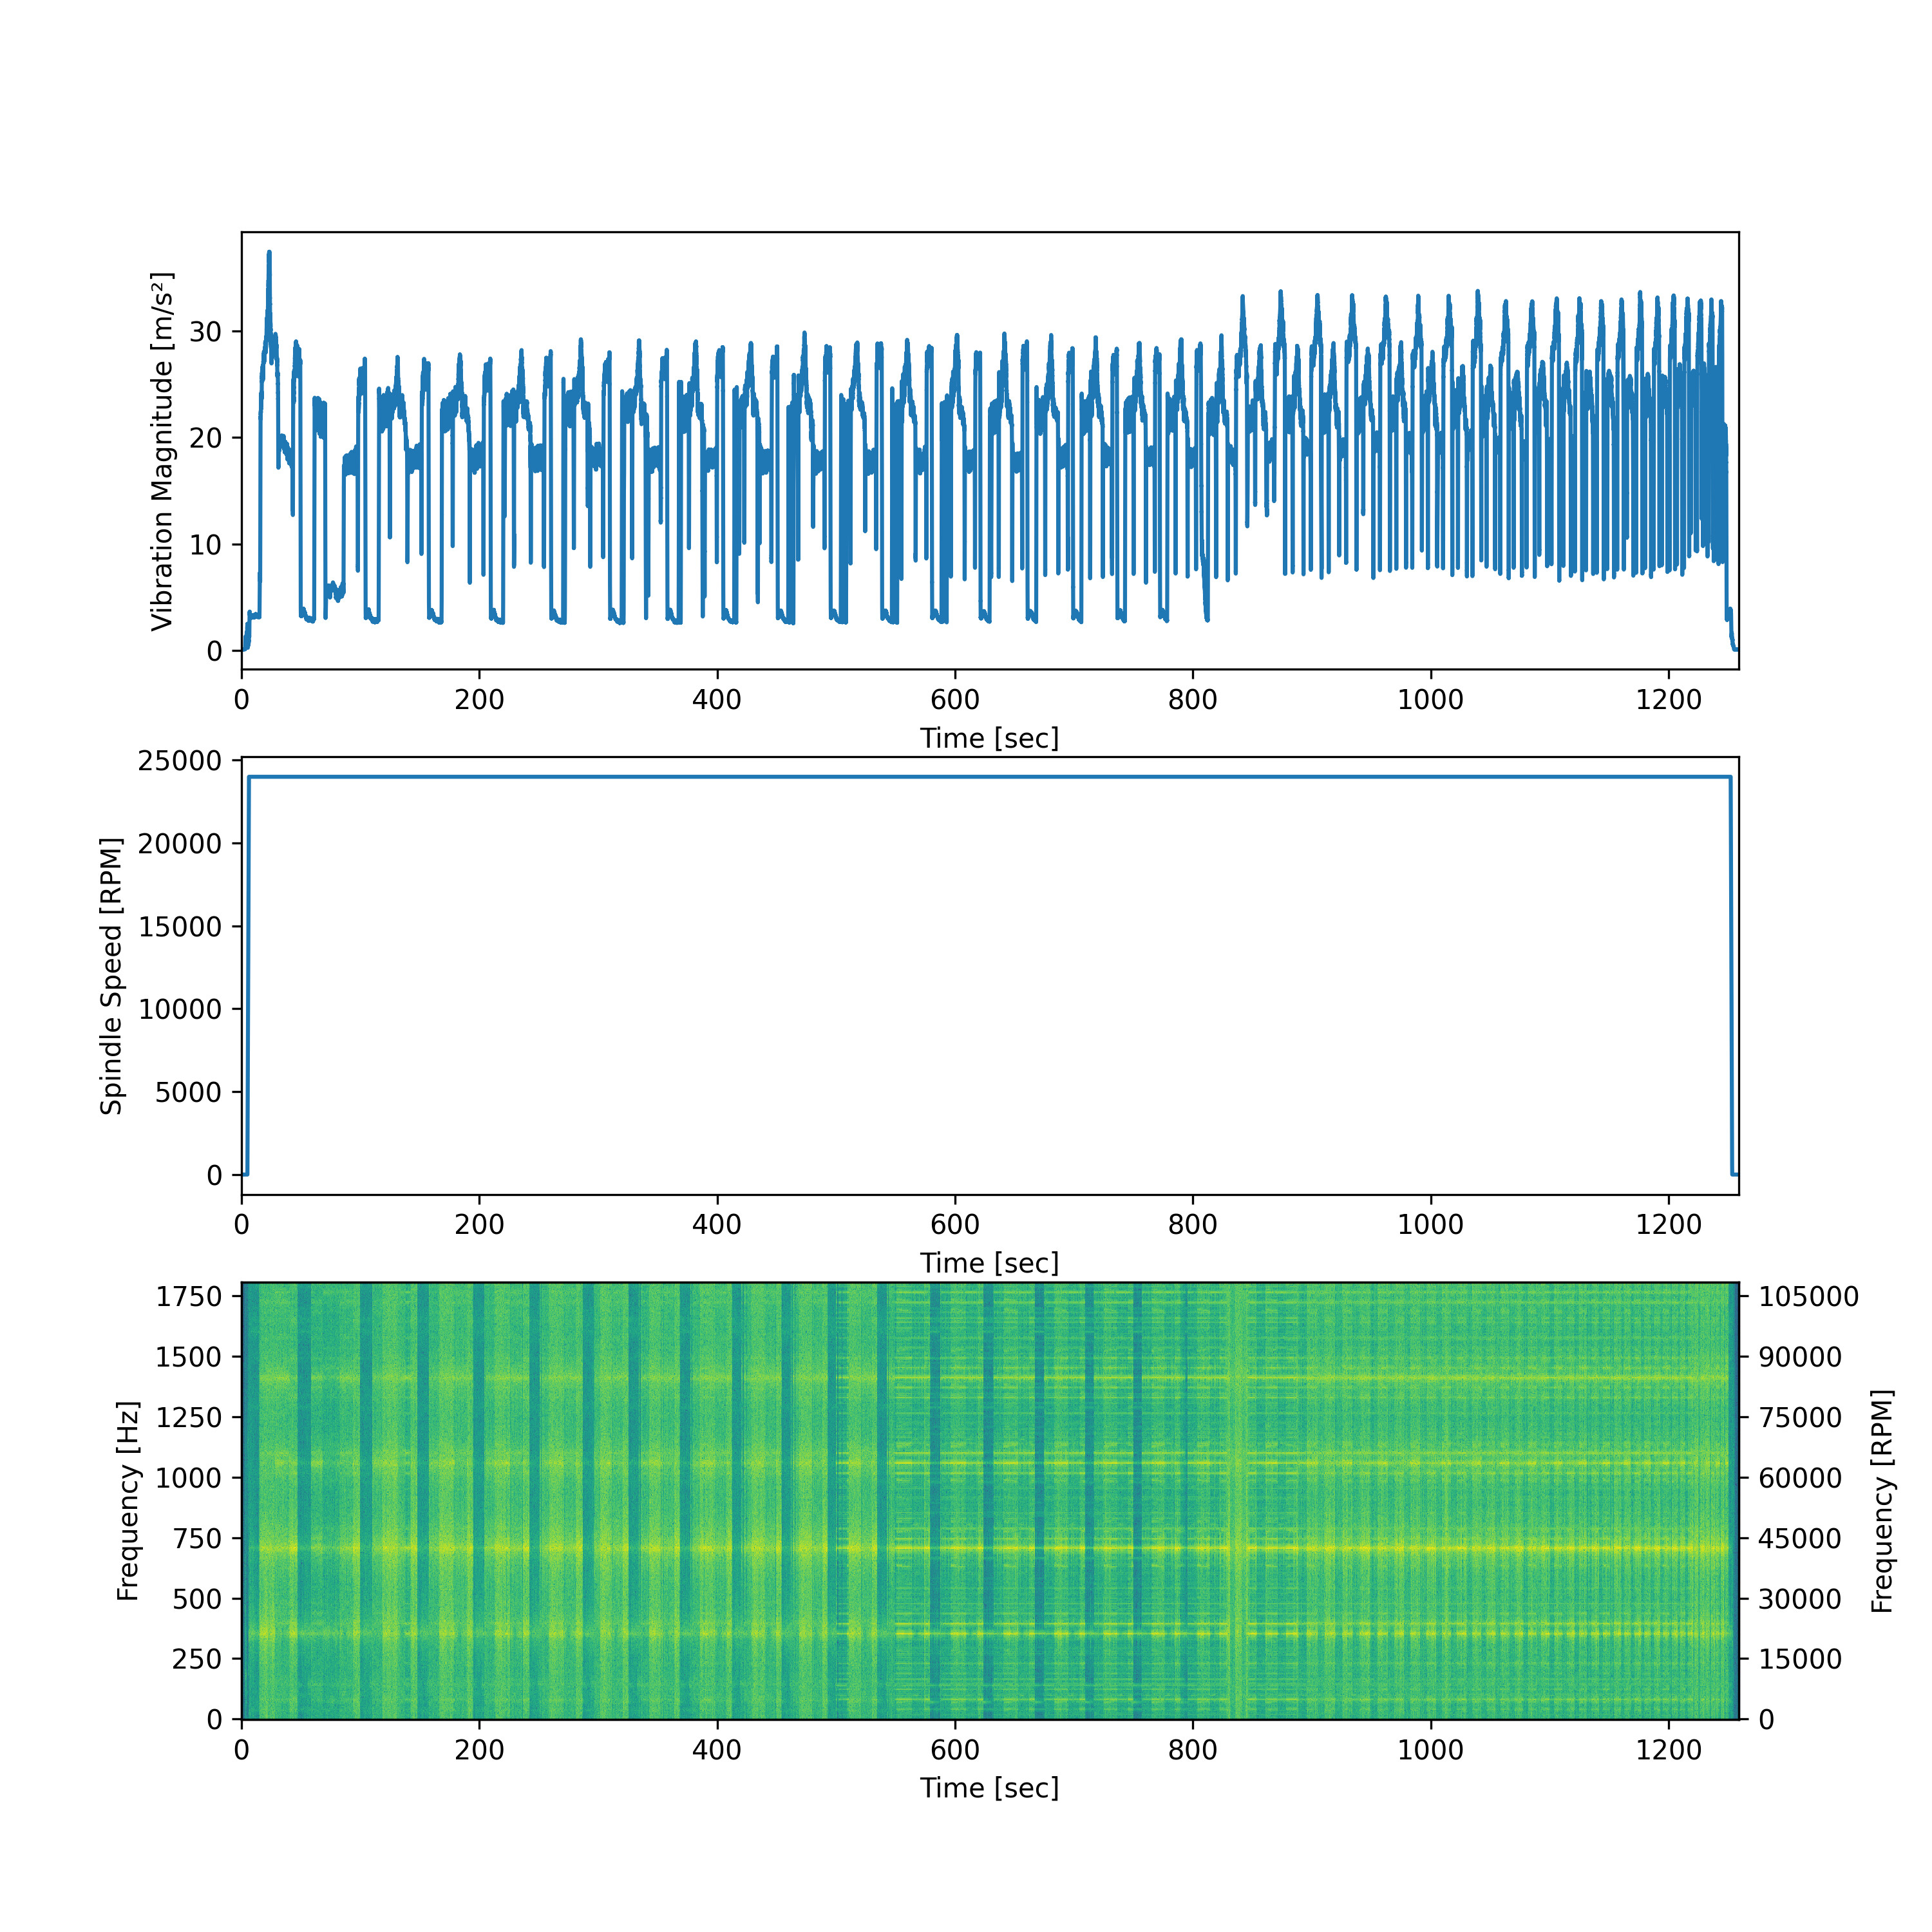
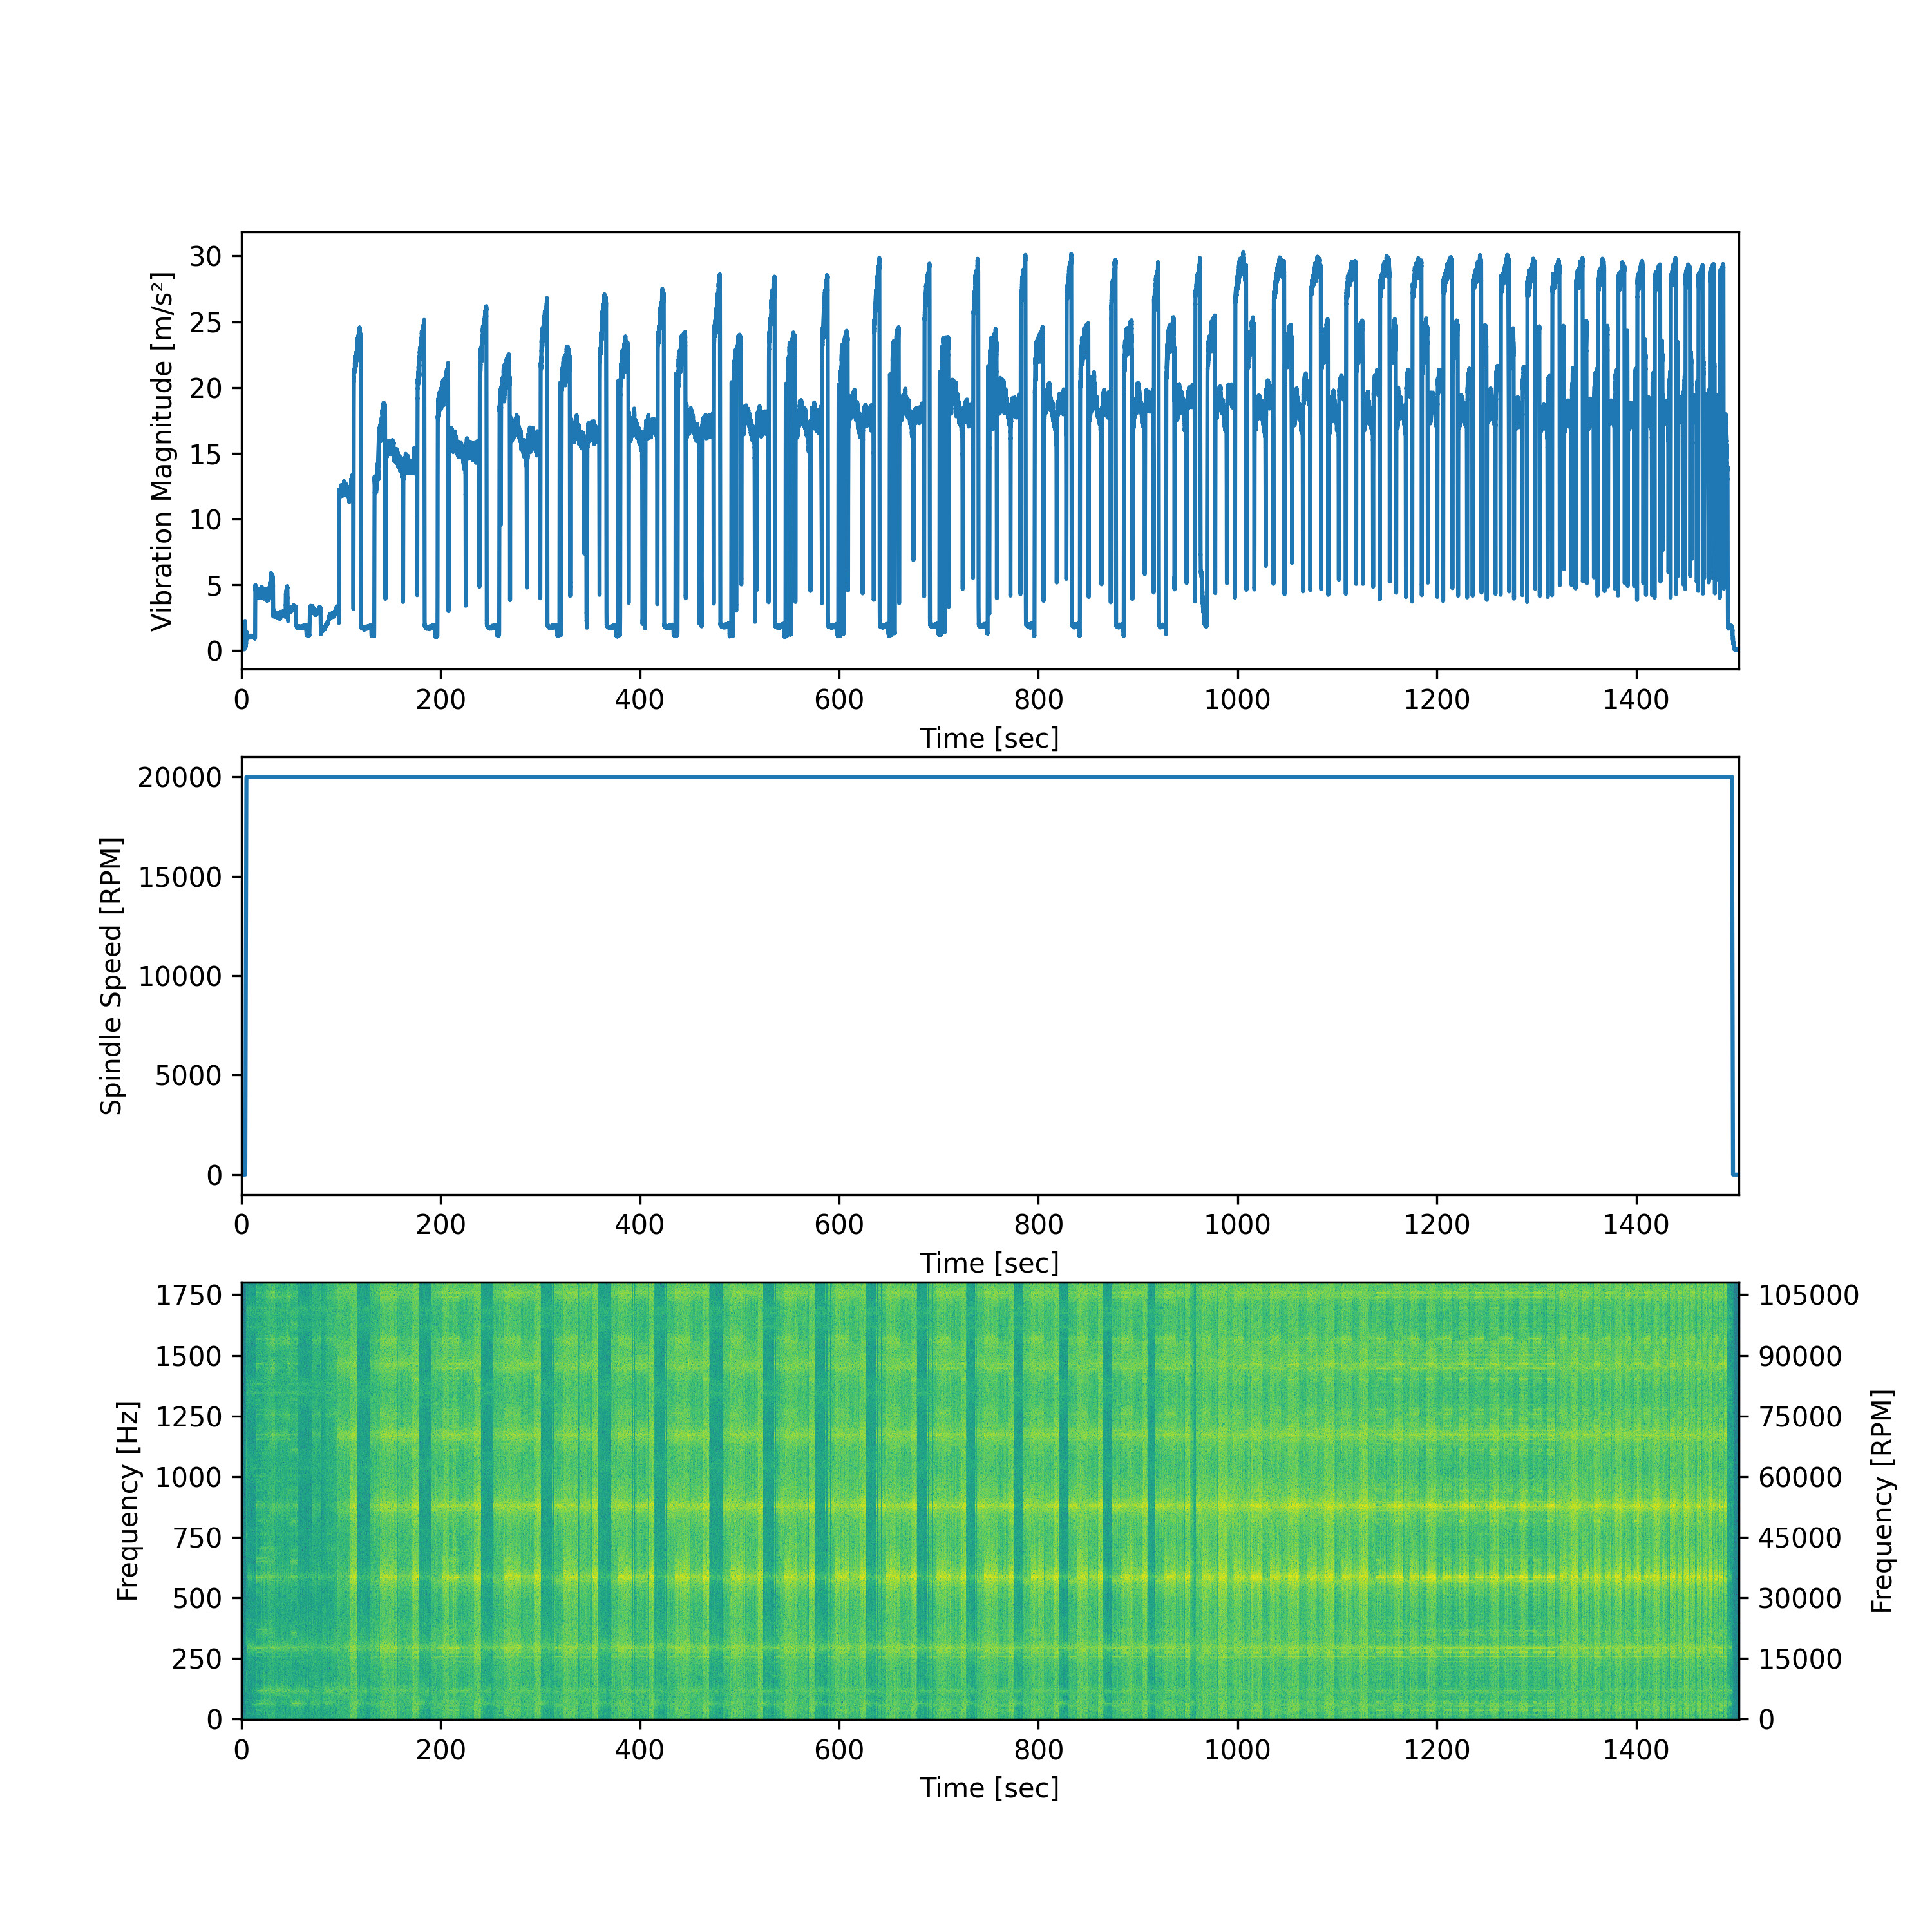
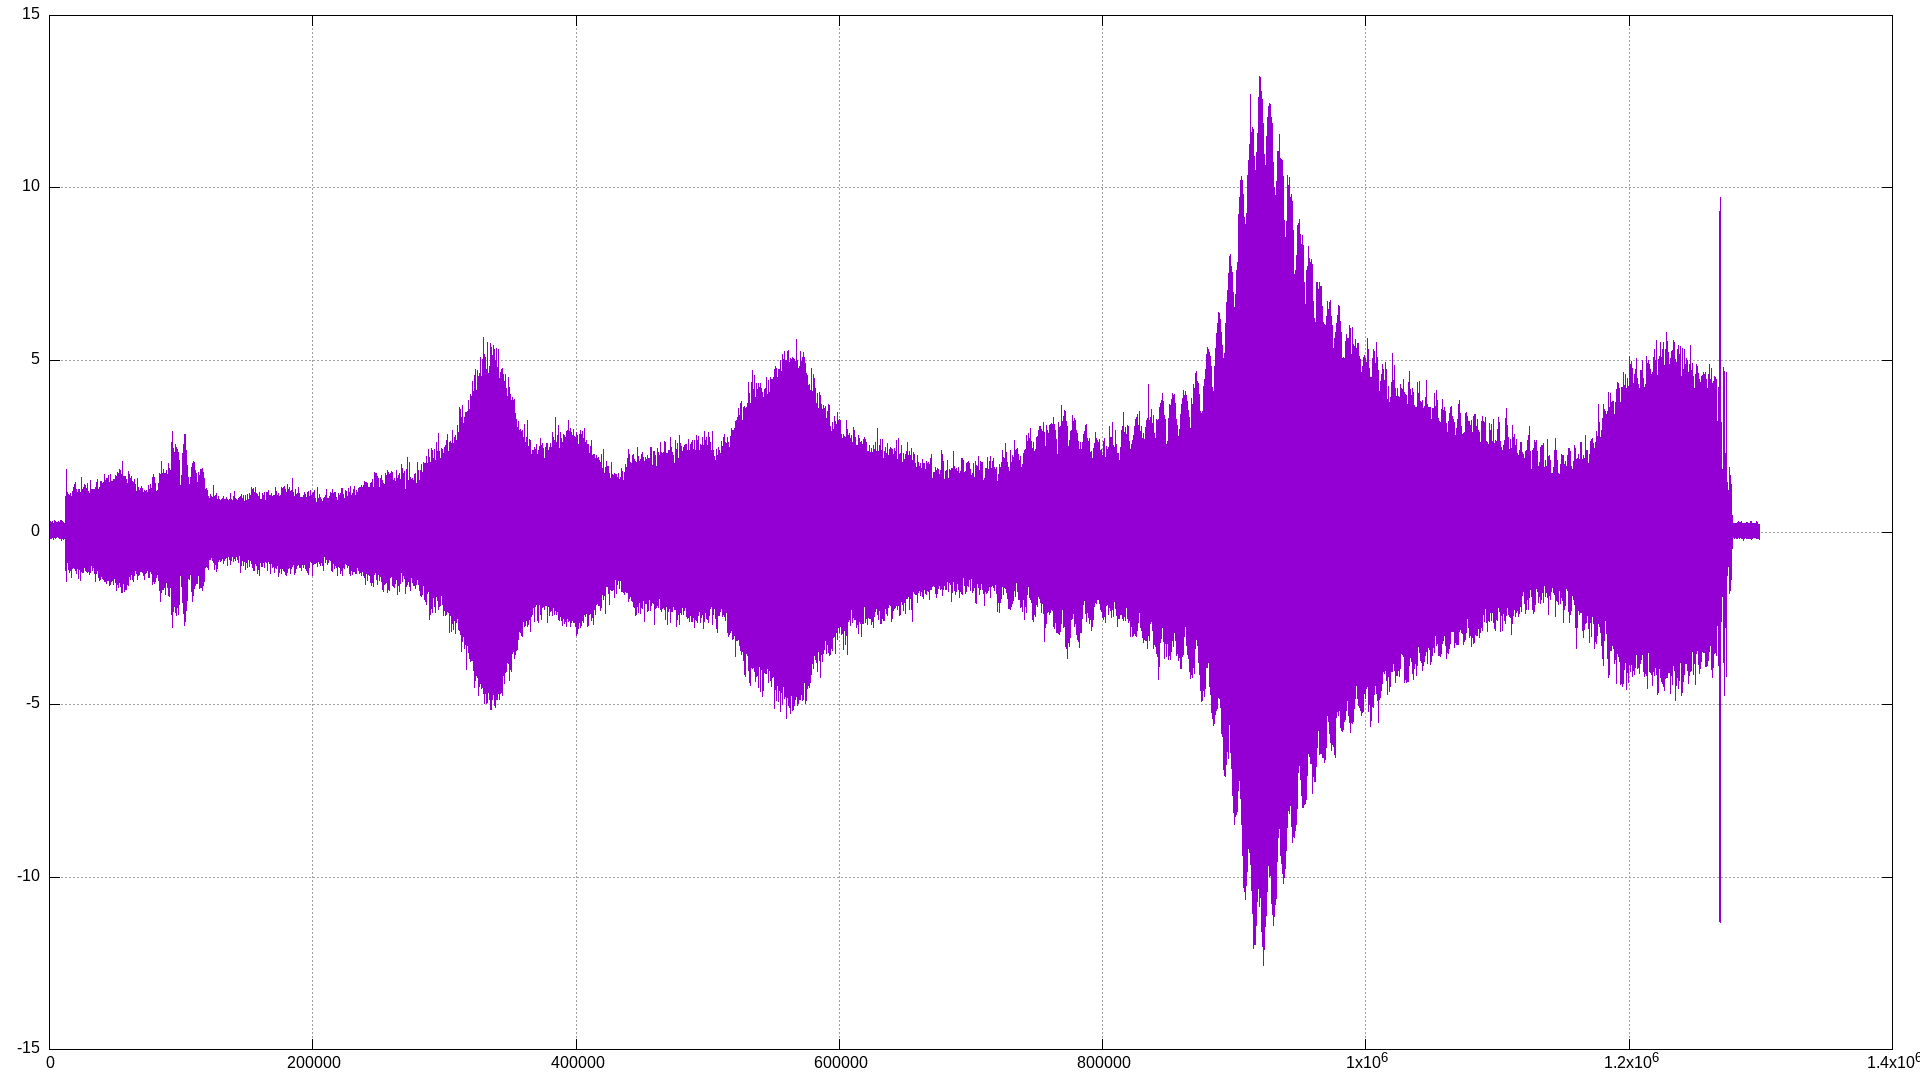
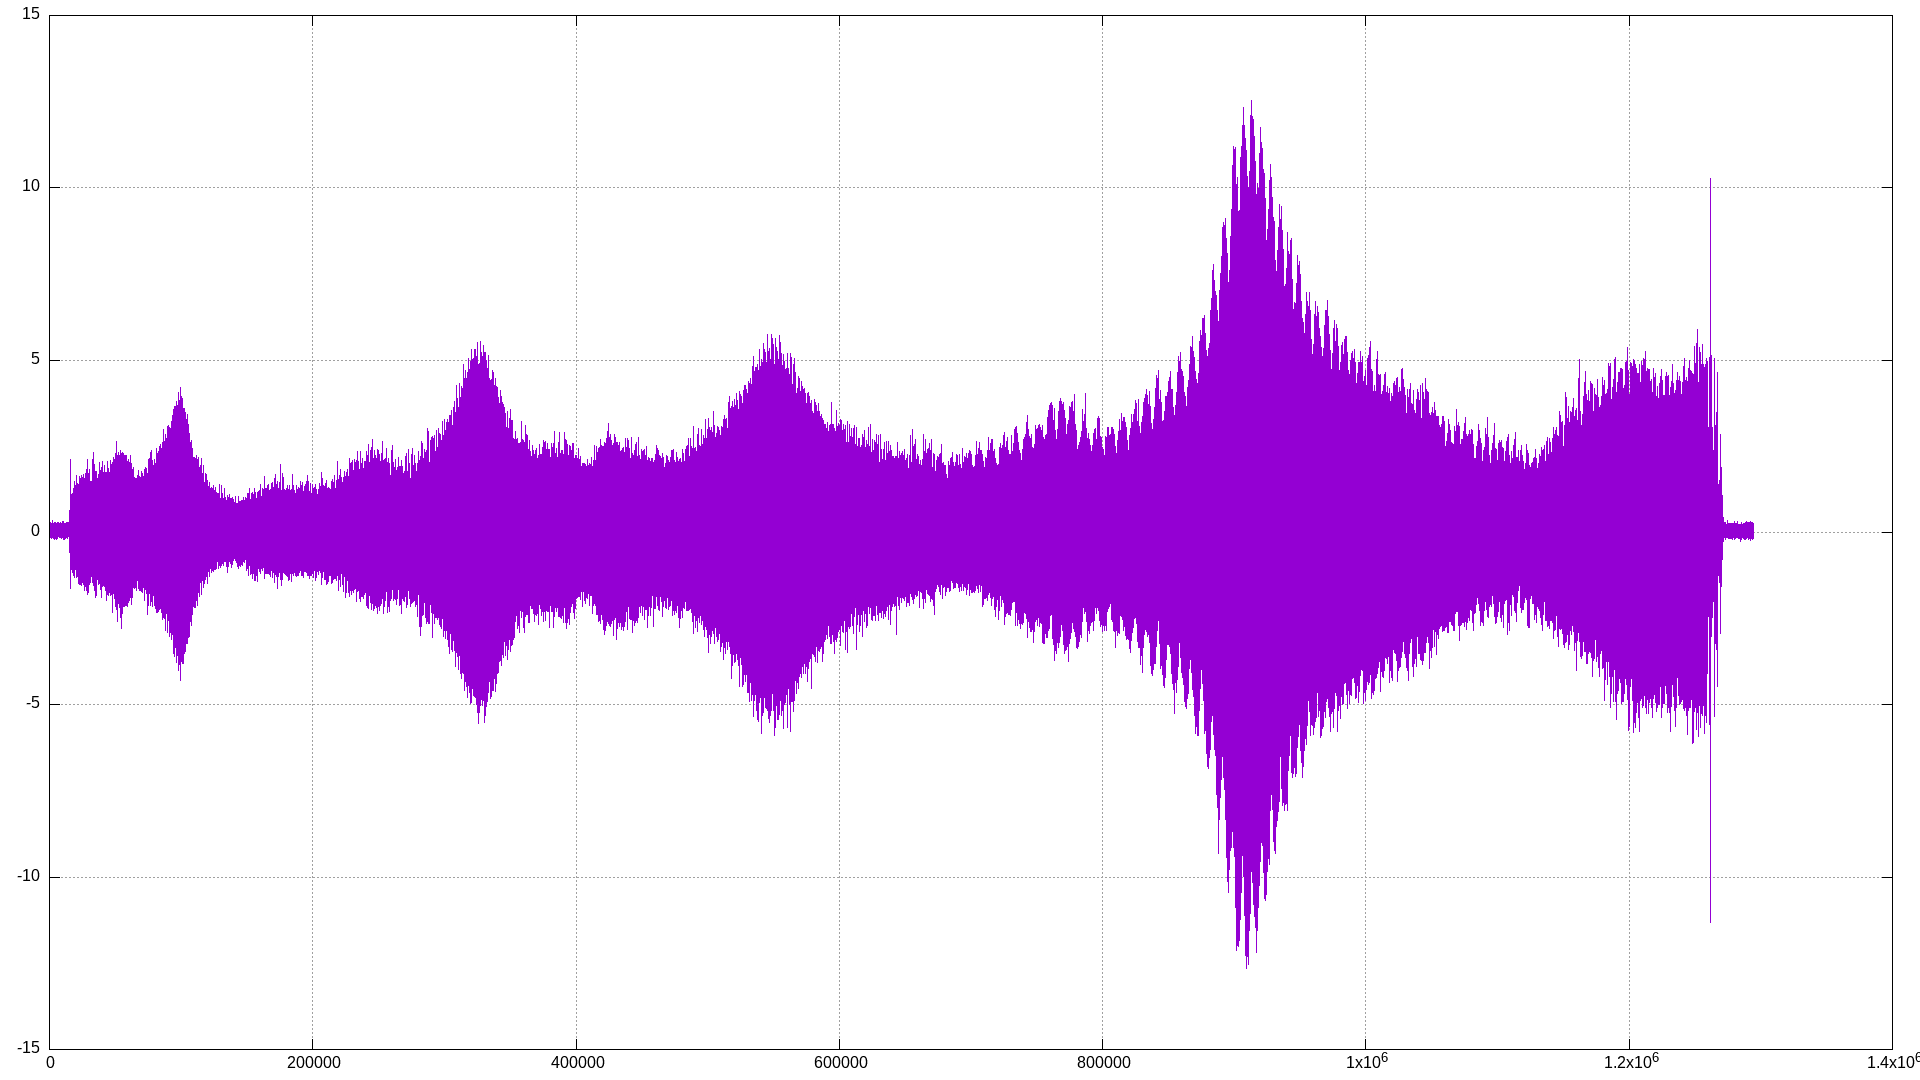
Conclusion: Needs more investigation. There is a difference, the 8mm tool peaks at ~11m/s² while the 12mm tool peaks at ~13m/s² but it’s not huge. Might need to try a wider variety of tools.

Does the tool diameter make a difference (e.g. due to mass)?

Shank diameter Collet Endmill Waveform
3mm GERC11-HP DIXI Polytool sampledata_speedramp_GERC11-HP_3,0_dixi
6mm GERC11-HP Sumitomo ASM2060DL sampledata_speedramp_GERC11-HP_6,0_ASM2060DL

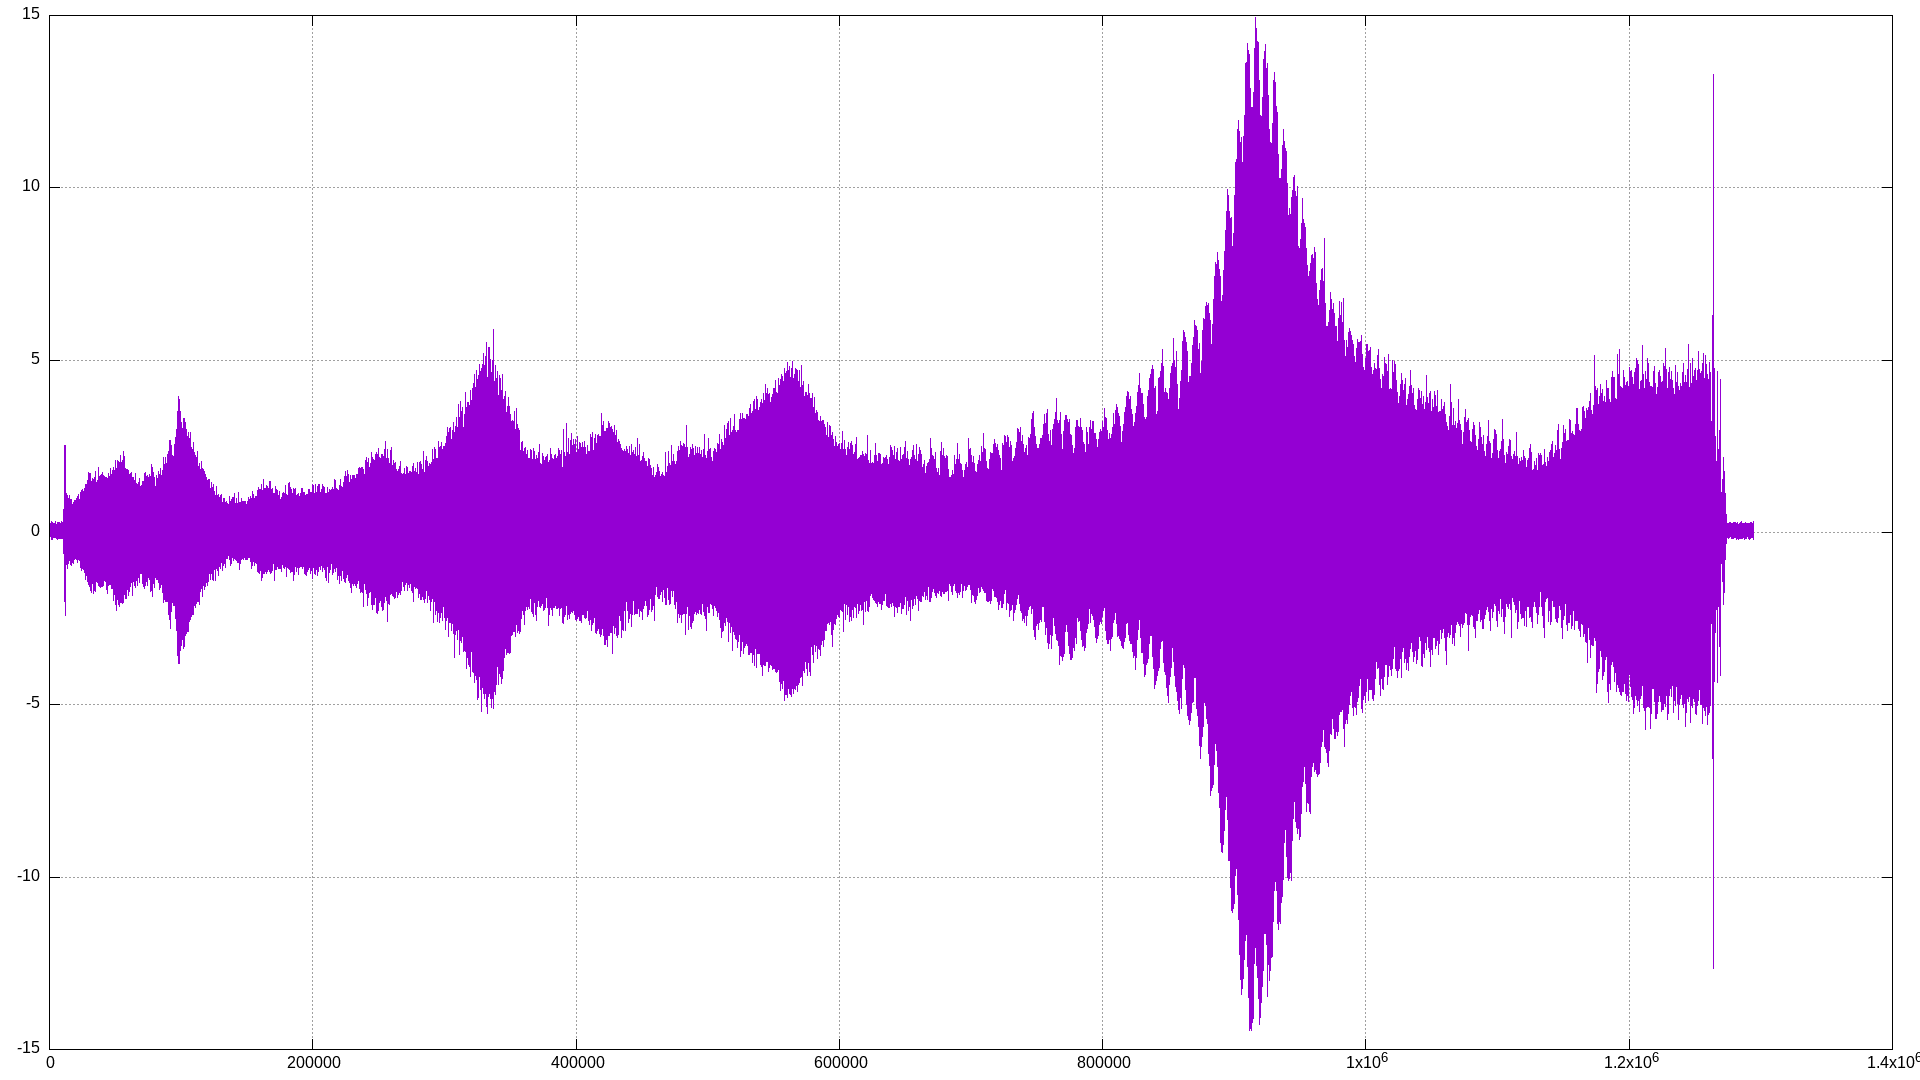
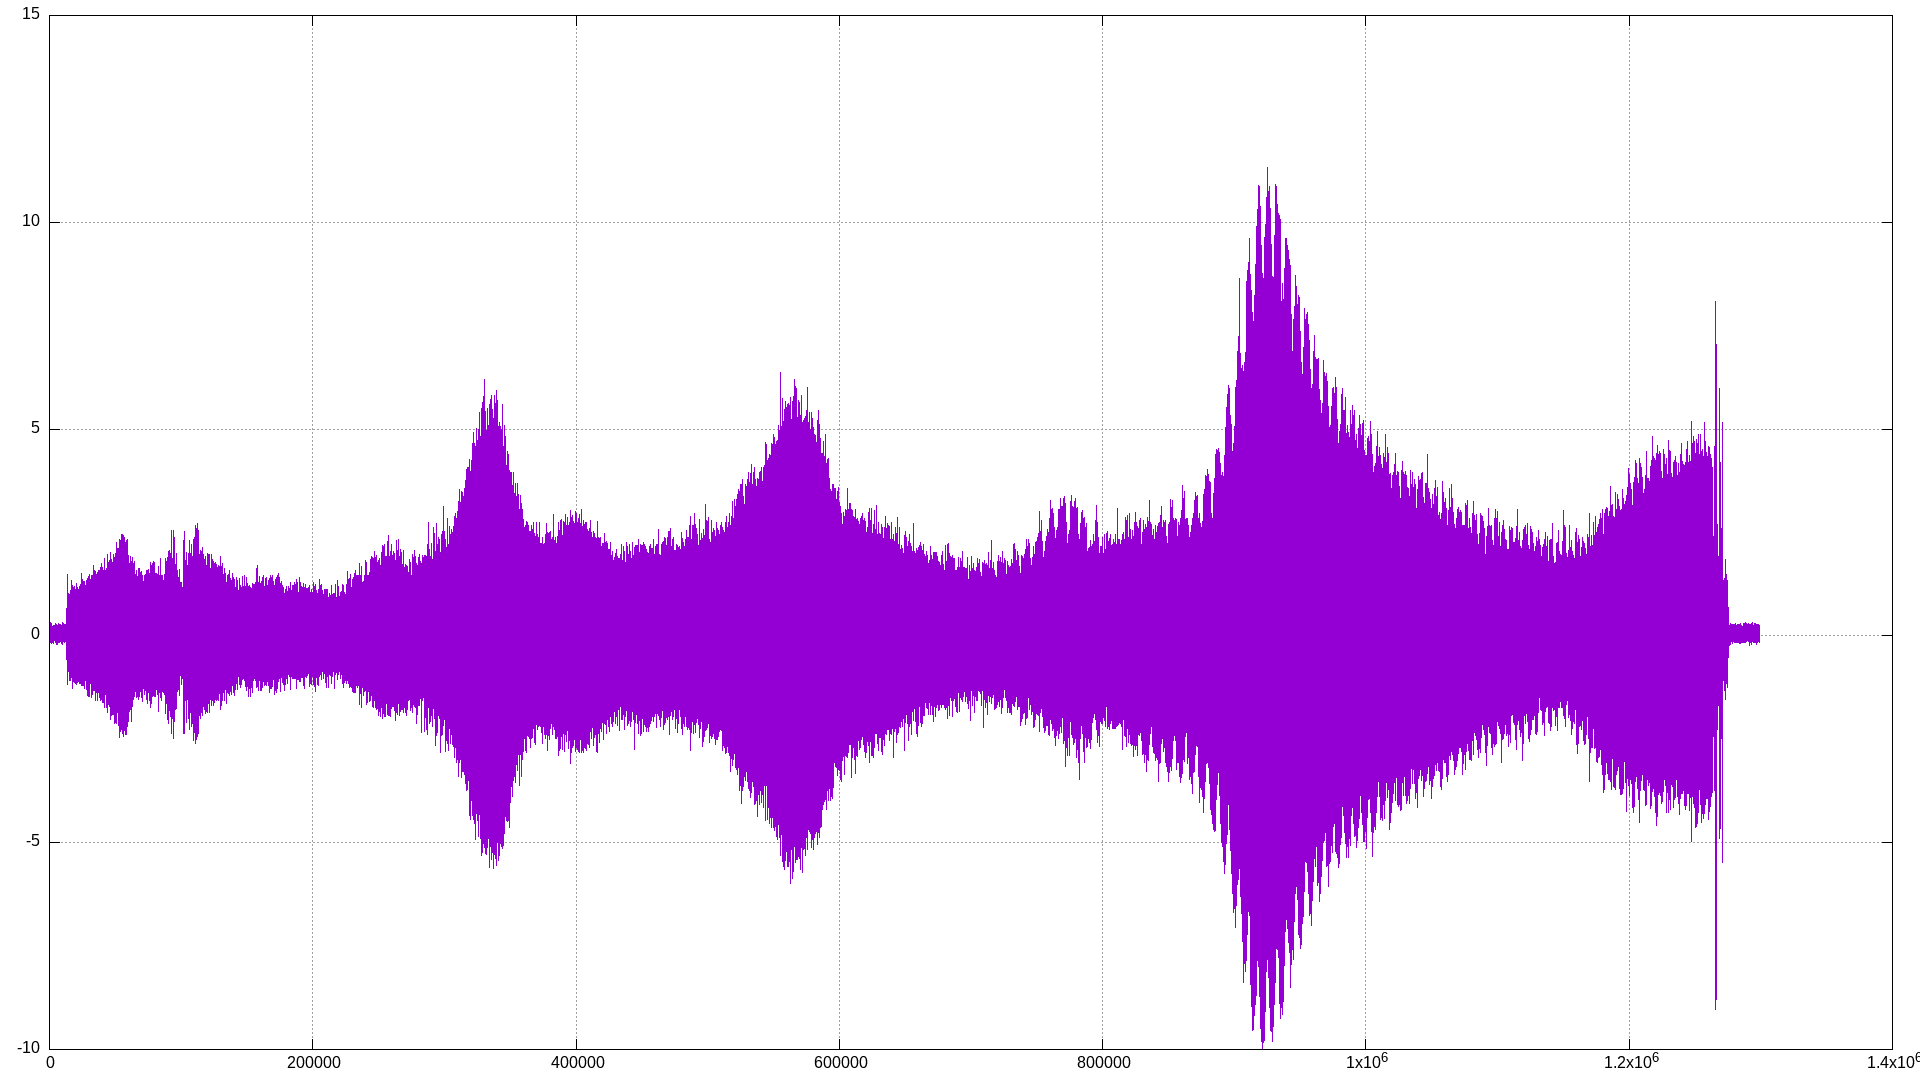
Conclusion: Yes. Bigger tool → more vibration.

Does the tool make a difference?

Shank diameter Collet Endmill Waveform
3mm GERC-11B DIXI Polytool sampledata_speedramp_GERC11-B_3,5_dixi
3mm GERC-11B CNCFraises EVOMAX sampledata_speedramp_evomax_GERC-11B_3,5

Conclusion: Yes. The peak around 400000 is different for both tools.

Sample 400000 by the way corresponds to somewhere in the region of 12k RPM.

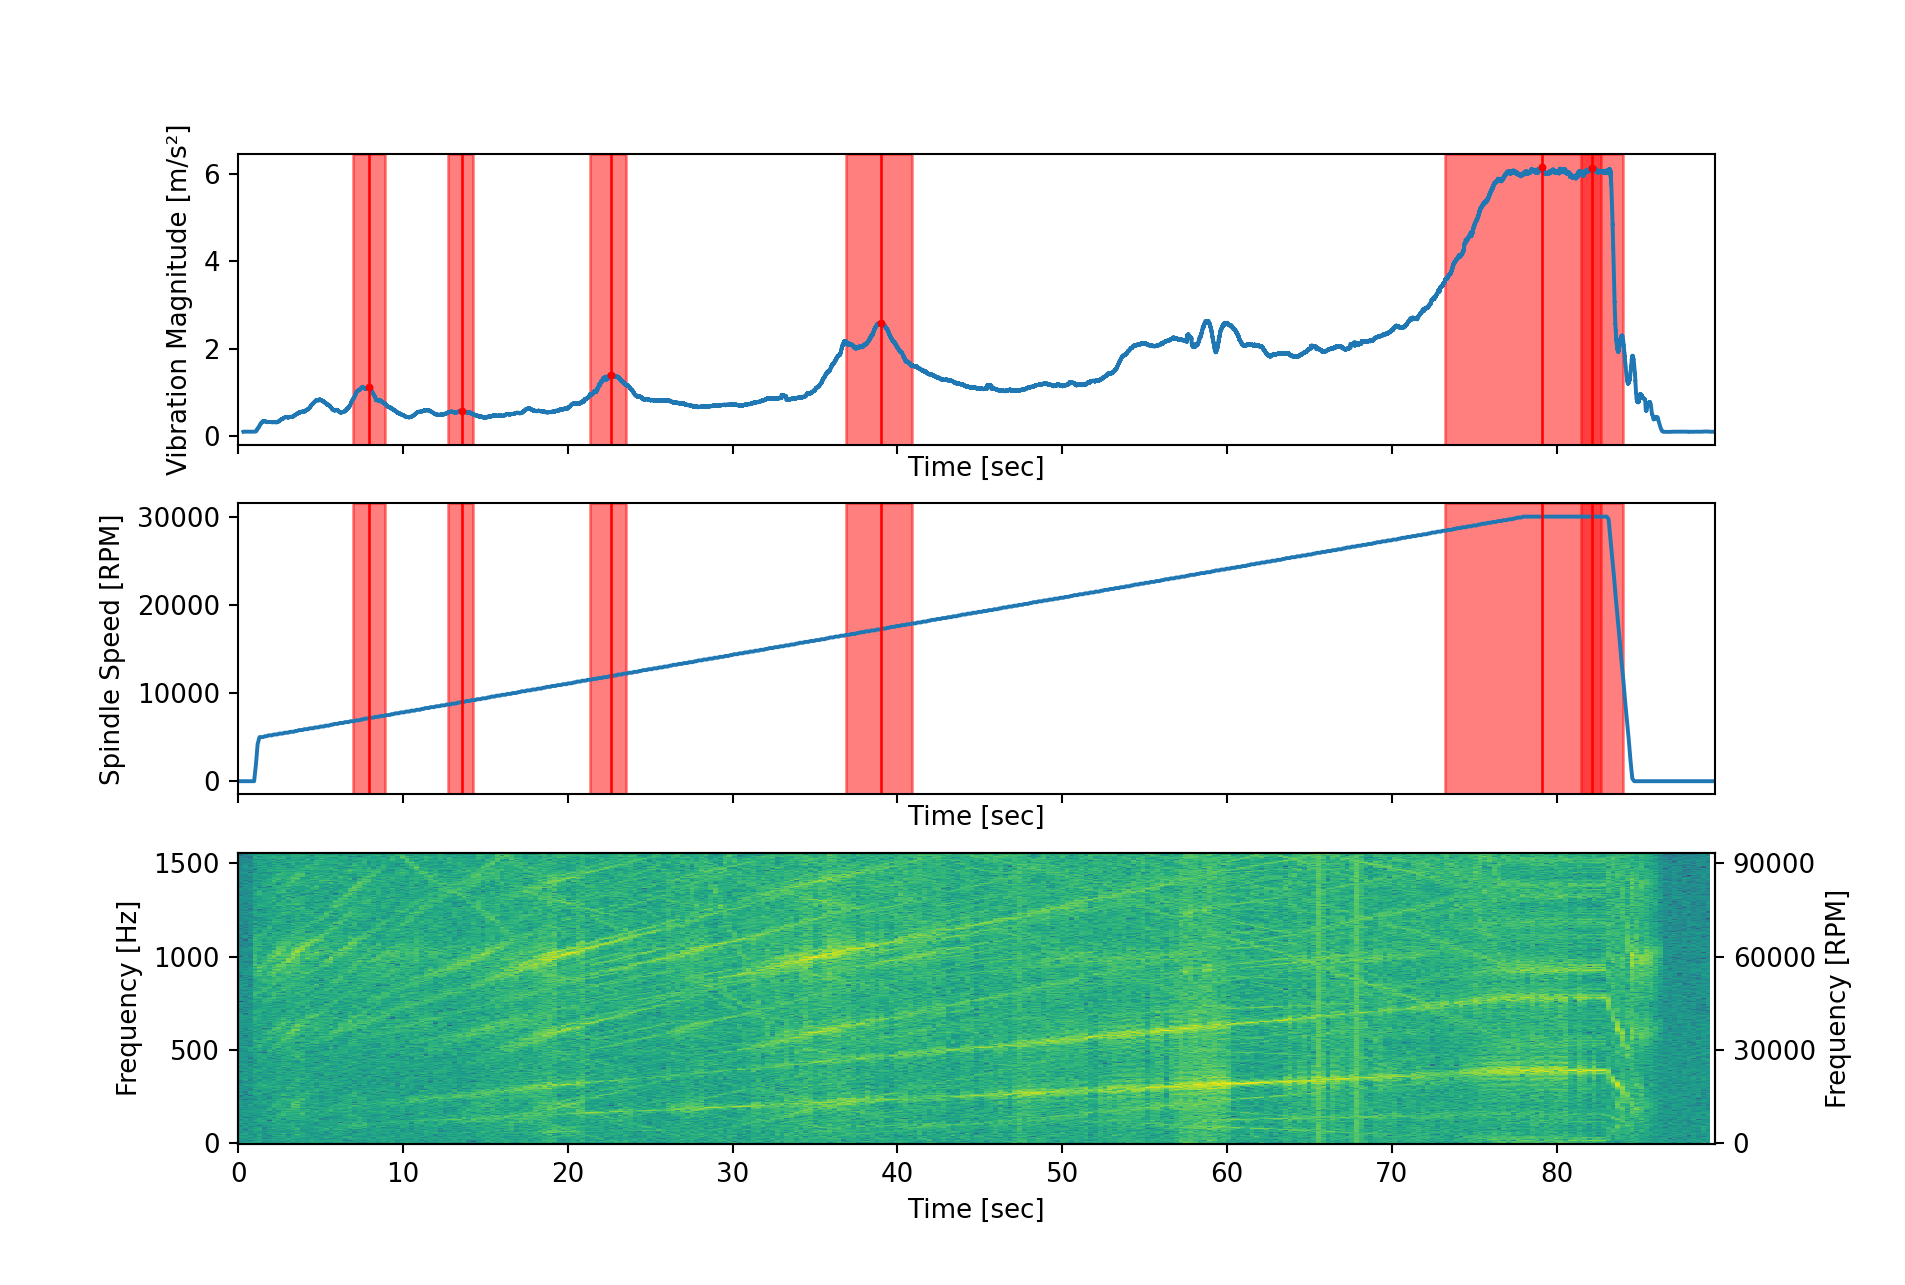
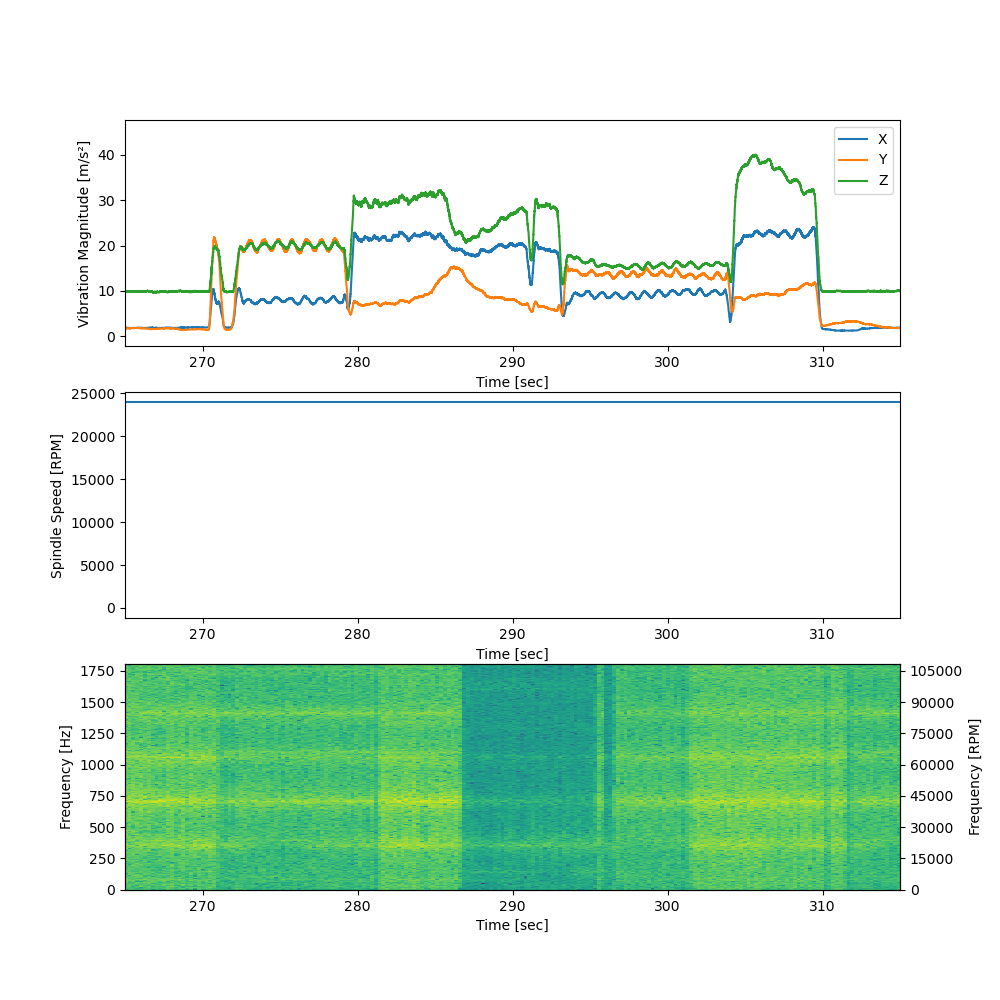
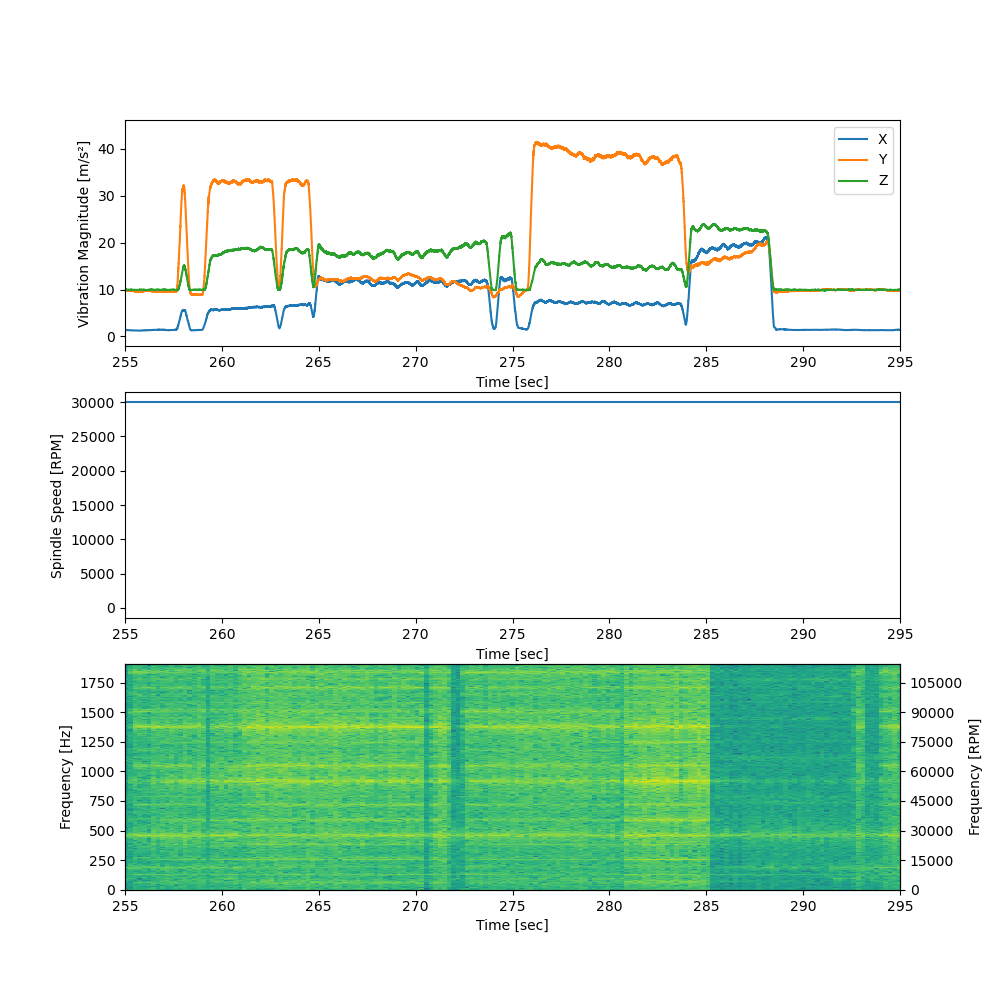
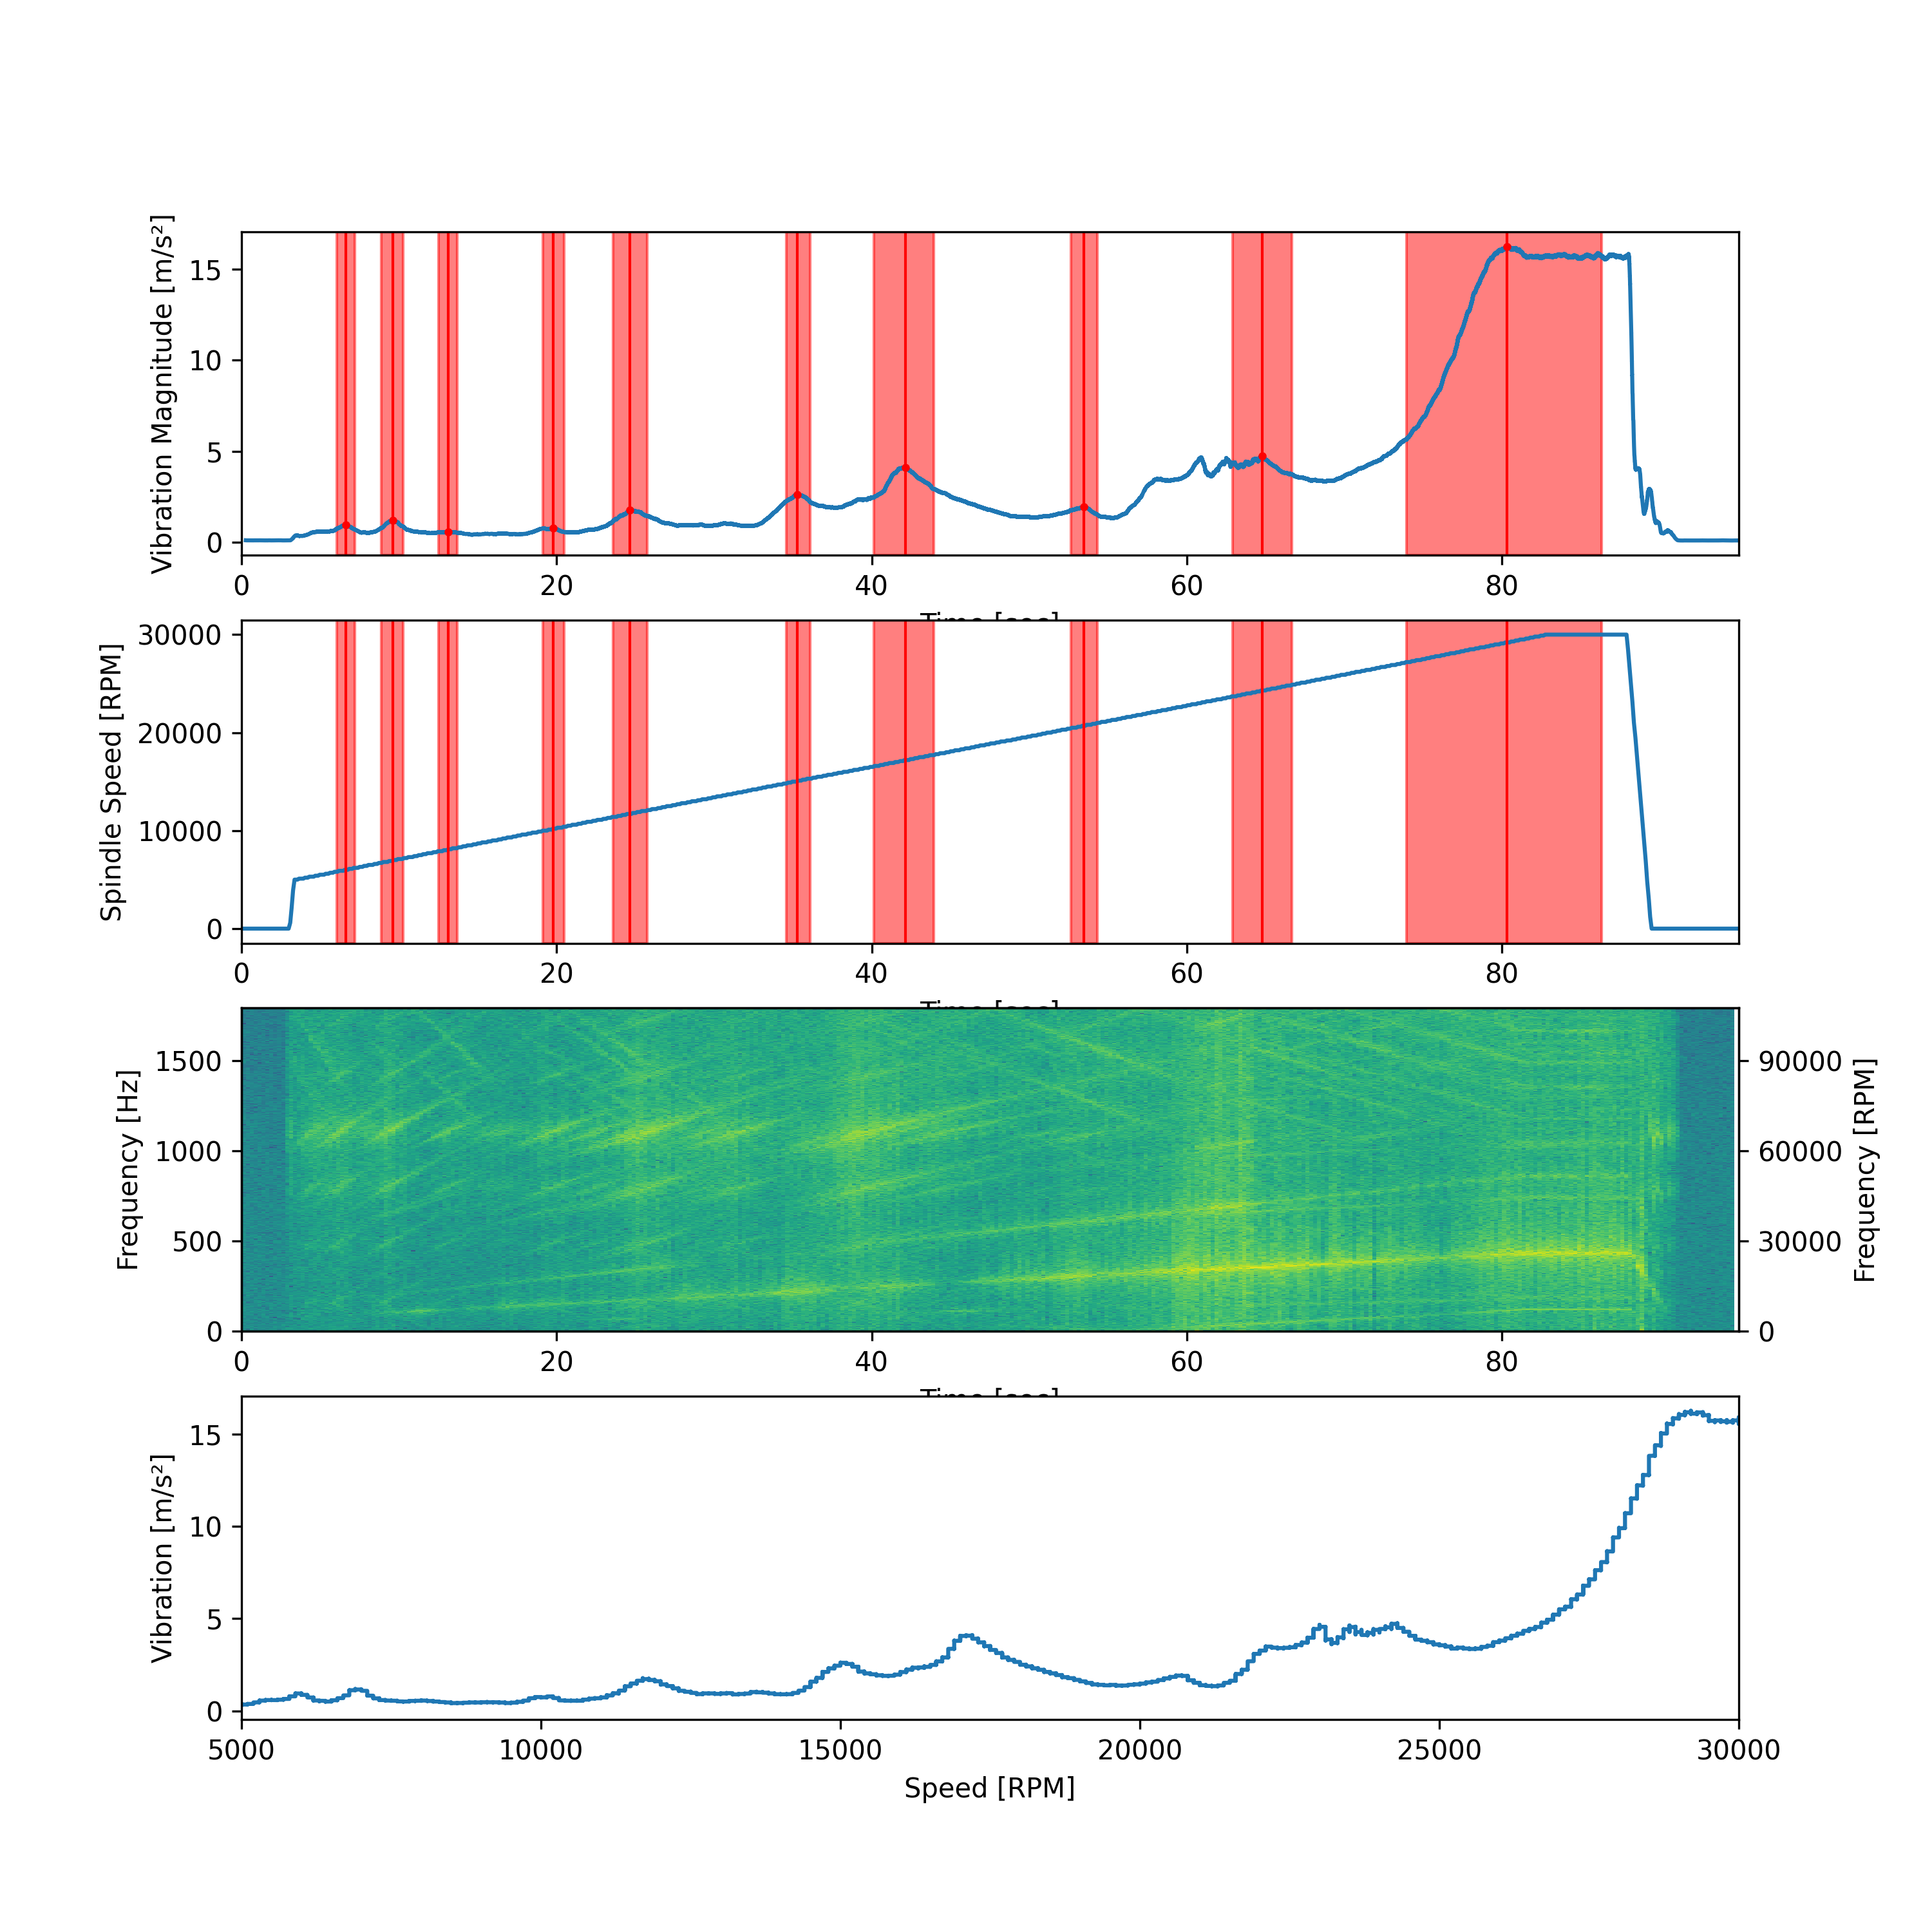
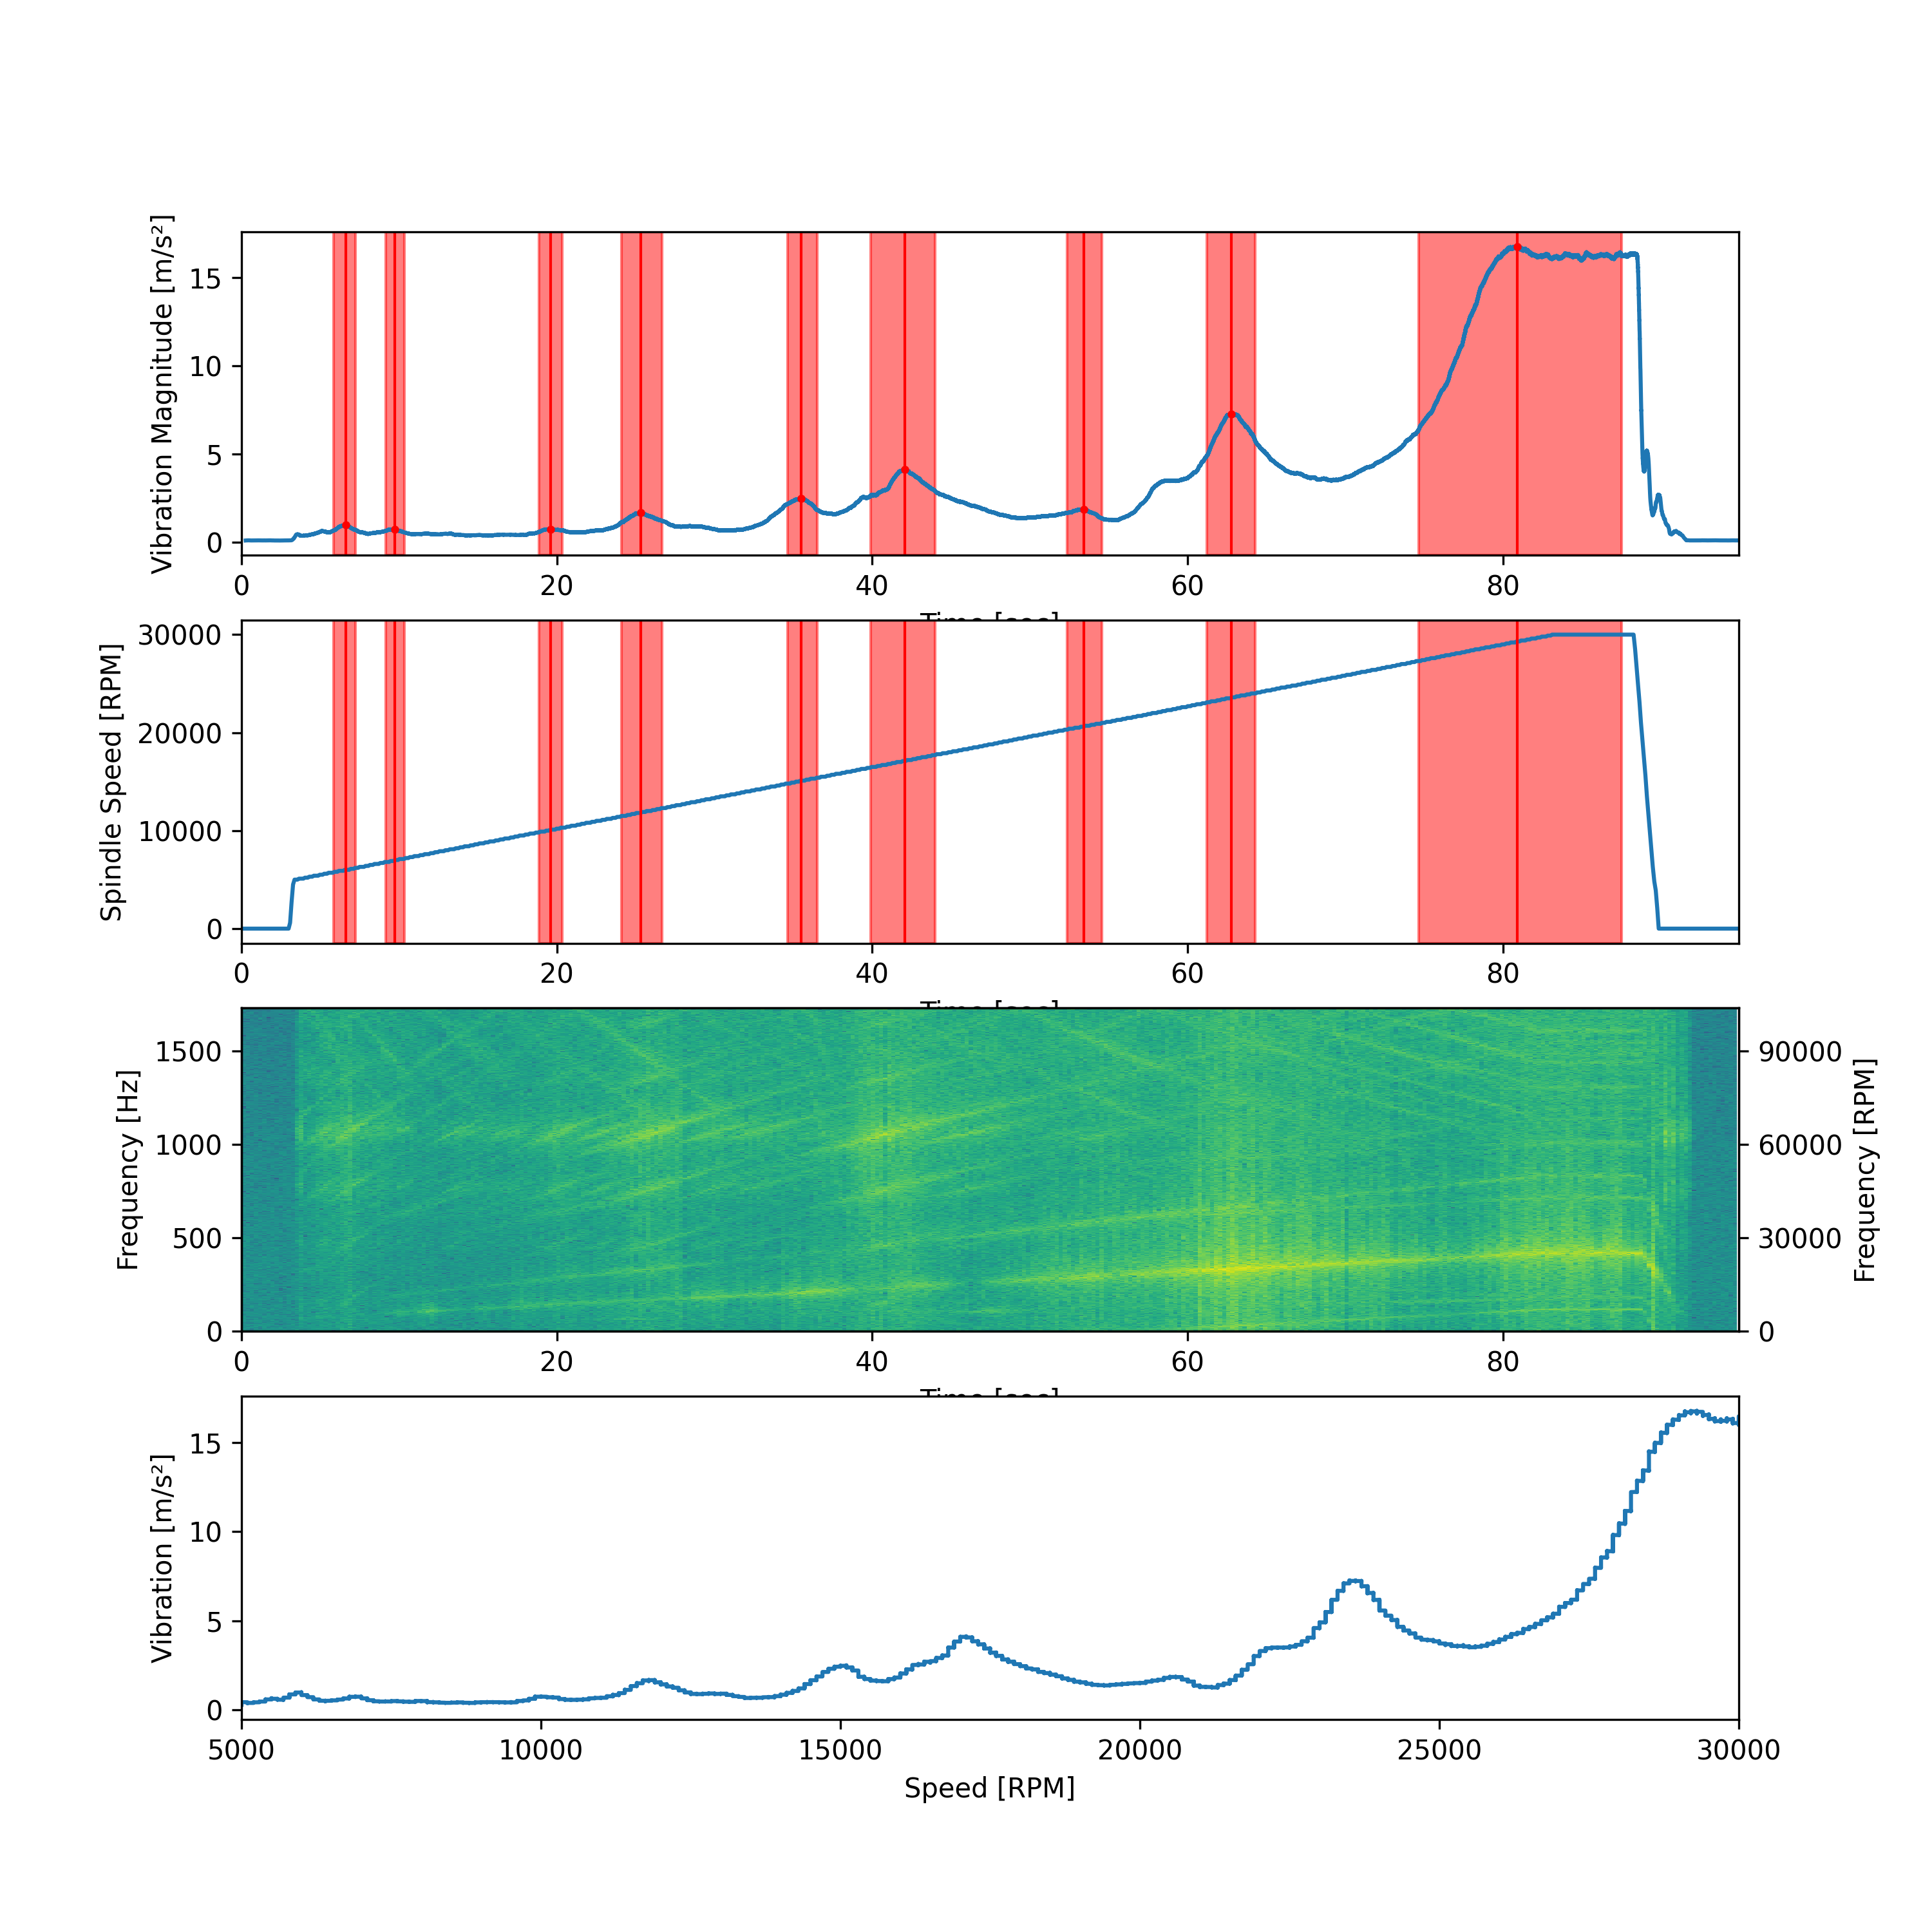
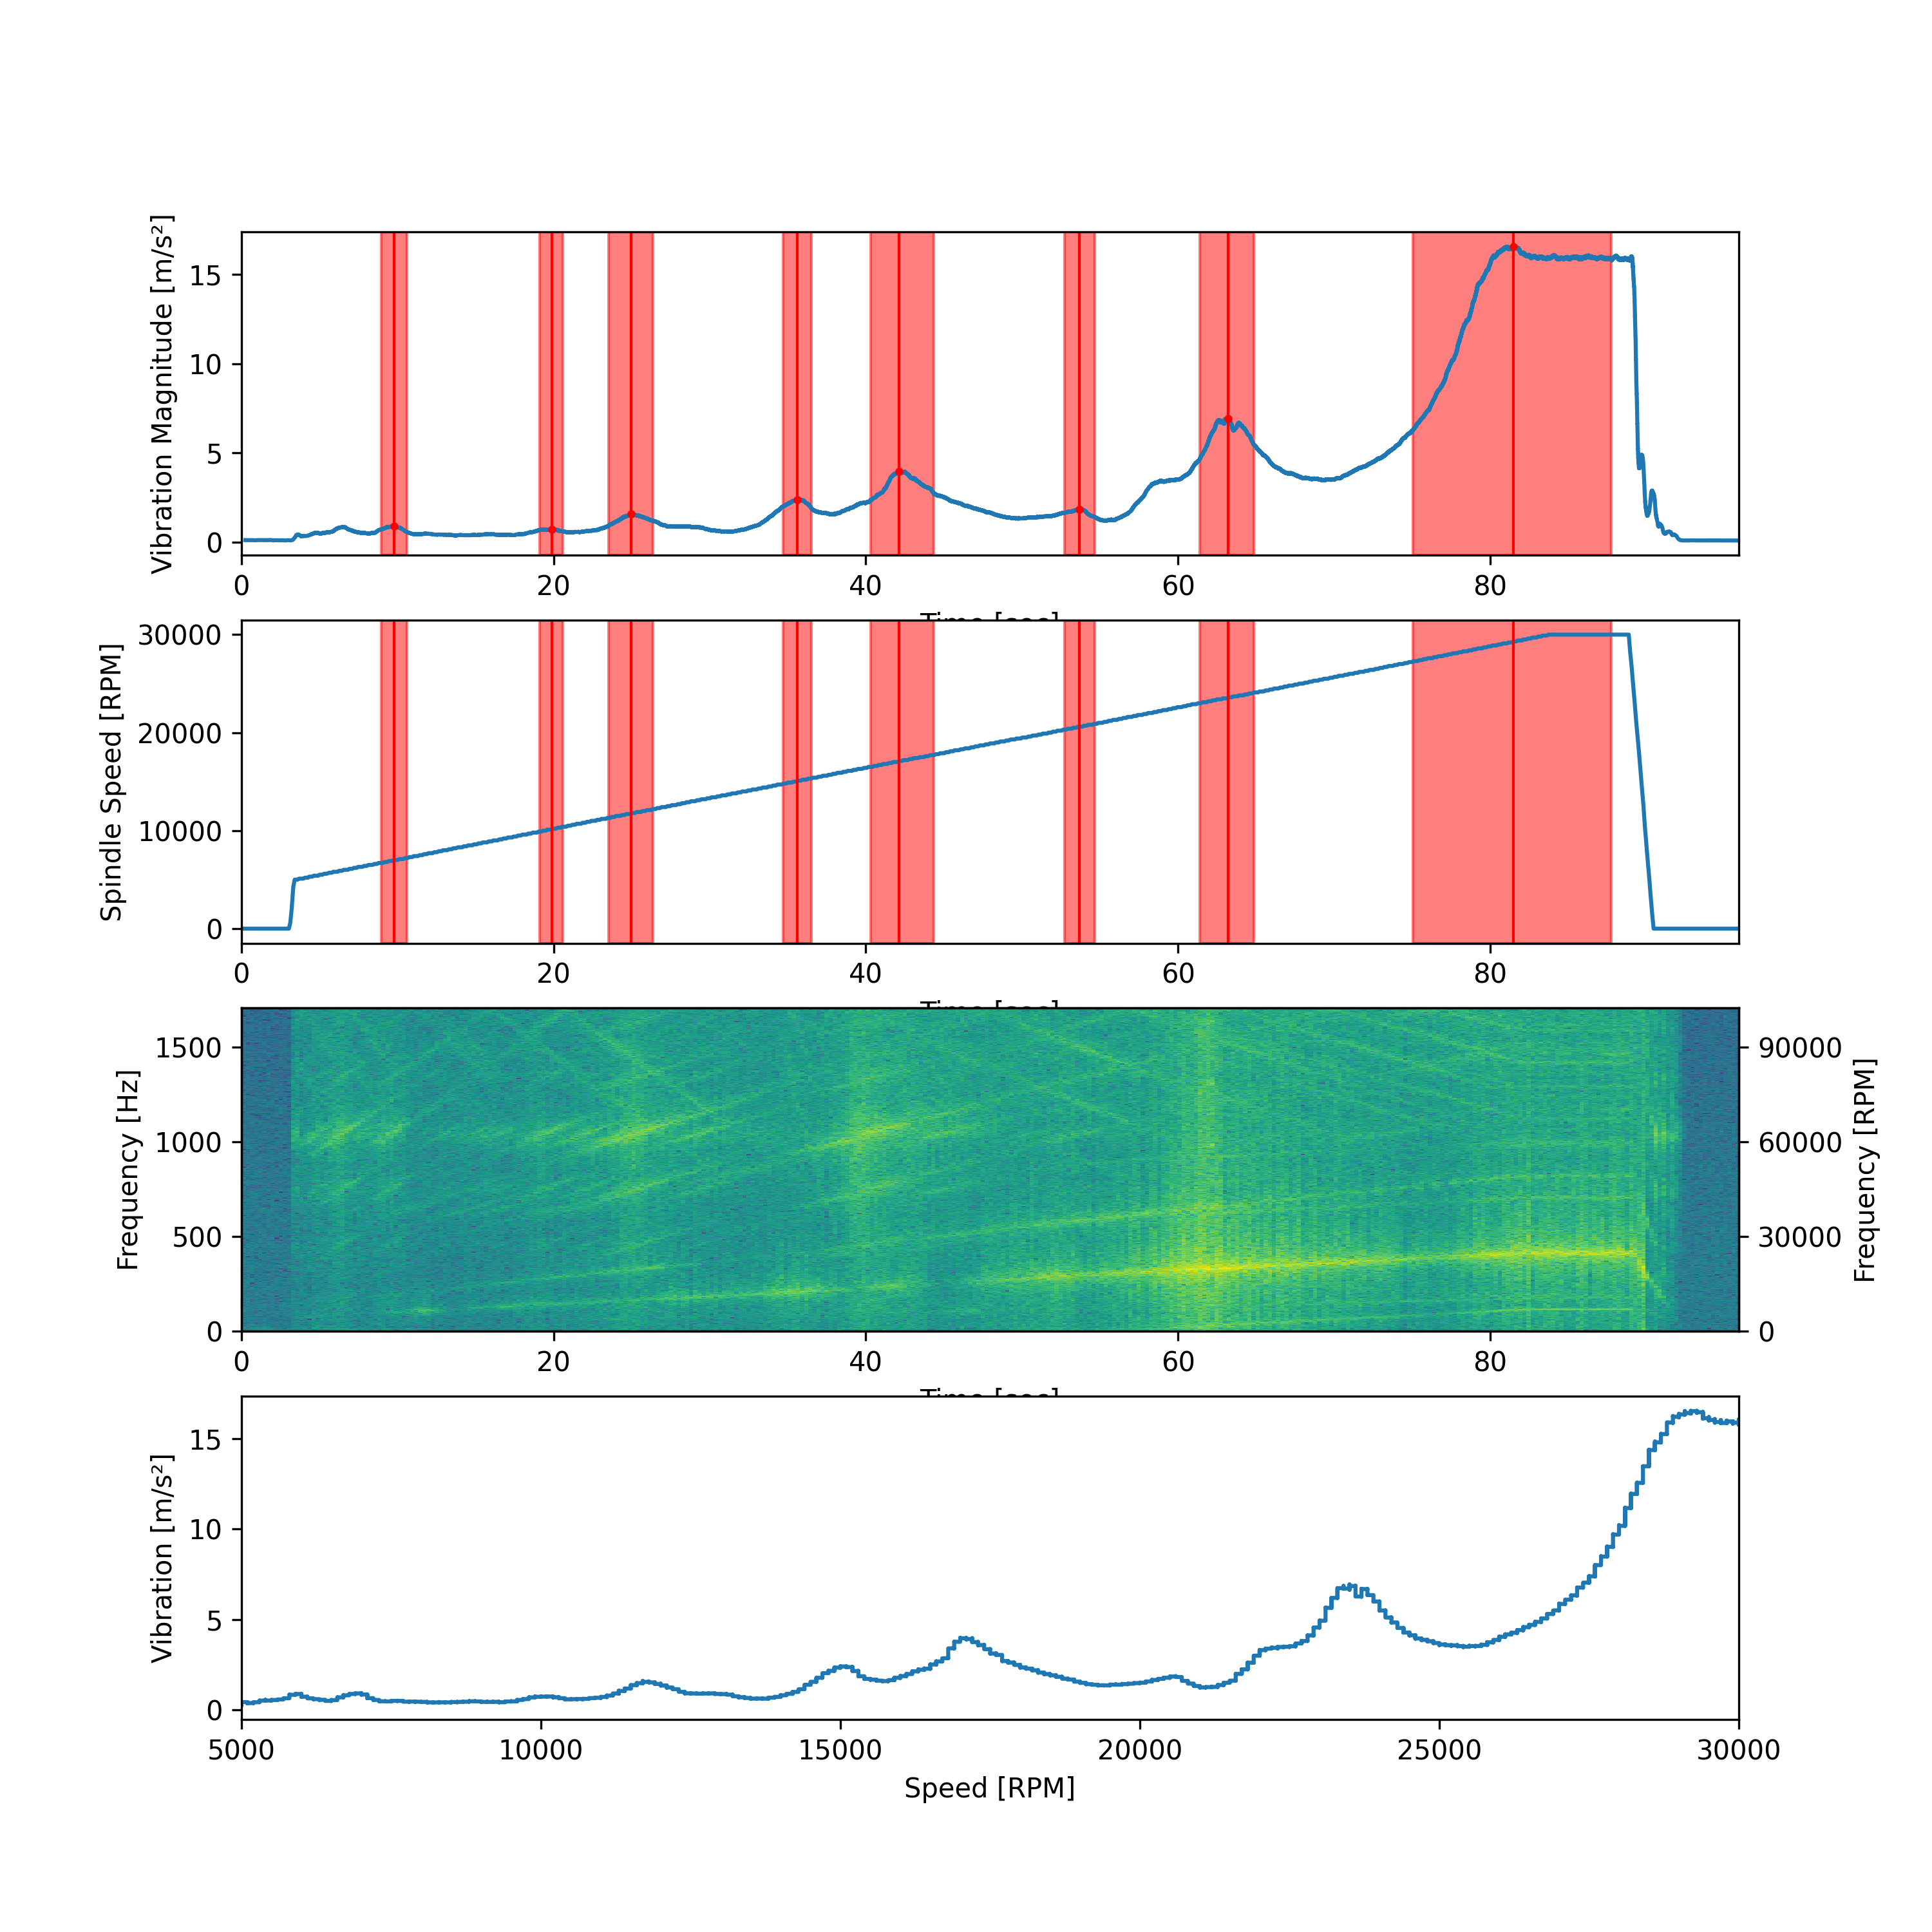
And because I have it laying around, here’s what a spectrogram looks like if I convert one of the CSV files to audio:

I have no clue what most of the lines I’m looking at are but it looks pretty. You can clearly see the spindle RPM ramping up.

My next projects are:

  • Actually cutting
    • If I run tools with similar specs and the same feeds and speeds, do I see a difference in the produced vibration, e.g. because of geometry or sharpness?
    • If I avoid the peaks I see when running the tool in the spindle without any load, do I see any positive results when cutting?
  • Looking at more tools
  • Analyzing the data using all three axes of the accelerometer and not just the X-axis
13 Likes

Very cool project! Definitely subscribed

Getting unloaded vibration data on a tool through the rpm could be very useful when figuring out feeds and speeds.

2 Likes

On that note, I’ve been working on instrumenting my CNC machine itself. I figured it didn’t make sense to go too crazy testing until I know I collect all the data I want, otherwise I’ll have to redo all the tests later.

The controller has a nice Python API which I can use to get all kinds of stuff from the machine but at the moment, I mainly care about the spindle speed and feed rate, which I collect at 10Hz and send to the computer that’s reading accelerometer data over UDP. Now I can combine the accelerometer data with the machine conditions, which I think will be really useful when looking at feeds and speeds.

I also left waveforms behind since the only thing I care about is magnitude.

My plots look like this now:

And my analysis script spits out a nice little report about where the peaks were found:

Peak:
	Magnitude:	1.12m/s²
	Start RPM:	6800
	Peak RPM:	7200
	End RPM:	7500

Peak:
	Magnitude:	0.56m/s²
	Start RPM:	8700
	Peak RPM:	9000
	End RPM:	9200

Peak:
	Magnitude:	1.40m/s²
	Start RPM:	11500
	Peak RPM:	11900
	End RPM:	12200

Peak:
	Magnitude:	2.59m/s²
	Start RPM:	16600
	Peak RPM:	17300
	End RPM:	17900

Peak:
	Magnitude:	6.15m/s²
	Start RPM:	28400
	Peak RPM:	30000
	End RPM:	11400

Peak:
	Magnitude:	6.15m/s²
	Start RPM:	30000
	Peak RPM:	30000
	End RPM:	30000

EDIT: Also just occurred to me I could plot vibration against RPM directly:

6 Likes

I posit that the peaks in vibration along the RPM curve result from resonance in the spindle/housing/z-axis/x-axis. Each of those corresponds to a different structure amplifying the vibration in meaningful ways. Theoretically, you should be able to get a better surface finish from troughs in the vibration, so while you could rough at 28,000, you should finish at 20,000.

However, does unloaded vibration even matter? It’s possible that when milling, the vibration involved with that is orders of magnitude more than this so perhaps this isn’t helpful in predicting performance. If you could recreate that curve while milling, then we would have more concrete data on whether the resonant structures are recreated or if they shift due to the frequency of the milling.

5 Likes

That plot is starting to look like a lobe stability diagram

And, as you suggest, on top of the underlying machine structure vibration modes there are then vibration modes for the cutter (including it’s flute count and it’s internal vibrations), the workpiece and the machine frame under cutting forces. The plot ends up being specific to a tool, stickout and workpiece on an individual machine.

That CNC Cookbook article is a decent intro to how various tools and methods are used to build these up.

4 Likes

I want to see the machine carve a graph of it’s own real time vibration data.
:exploding_head:

5 Likes

Could your theory be verified by collecting vibration data from those parts of the machine as well? I have at least another two accelerometers I could wire up.

That’s one of the next hypotheses to test: does milling outside of or on top of the unloaded peaks do anything.

But this isn’t just about finding the optimal spindle RPM. I’ve already seen that the curve changes when I vary the collets and endmills, so I suspect the unloaded vibration chart is indirectly measuring tool balance/concentricity.

Could your theory be verified by collecting vibration data from those parts of the machine as well? I have at least another two accelerometers I could wire up.

Perhaps. Because the system is currently connected, you would need to disconnect the sections and analyze them, but then that would be difficult to do. The quick way I might play around with it is to increase the mass of certain axis and then retest. You should see peaks shift or dampen in amplitude due to the increase in mass. Ways I would do this are to double-sided tape chunks of metal to axis and see if it does anything. Filling the extrusions with sand would be pretty simple and certainly more helpful in changing the entire axis mass as an average instead of in point locations. You may be able to run the test and try grabbing different sections and see how that changes things to figure out which peaks are from what parts.

But this isn’t just about finding the optimal spindle RPM. I’ve already seen that the curve changes when I vary the collets and endmills, so I suspect the unloaded vibration chart is indirectly measuring tool balance/concentricity.

Agreed and if concentricity/balance is what you seek, then it looks like that’s a reasonable way to do it.

1 Like

Minor update: I’ve been thinking about how to test collets, as I’m getting a few more to test.

One thing that occurred to me with the collets specifically is that perhaps the results may be expected to have some variance. That is, if the vibration is linked in any way to concentricity, the collet may have an effect due to how it’s rotated in the collet holder.

So I did a few tests to see how they varied. All tests were with a CNCFraises FC1DA3008 endmill and a Fahrion GERC11-B 3.5mm collet. Between each test, I completely removed the collet nut, the collet and the endmill and then re-assembled everything.

Results (I compare them by opening them in tabs and switching between them):

Interestingly, the first three results were mostly the same, there was just a mysterious bump in the first result that was filled in by runs 2 and 3.

Weirdly, the total magnitude in runs 4 and 5 was significantly reduced compared to 1-3. 1-3 averaged around 16.5m/s^2 while 4 and 5 were around 12.7, a full 23% less!

I’m really not sure what’s going on there. Could be a measurement issue, could be a tiny chip that got stuck and cleaned out, could be I tightened it better, needs more investigation.

1 Like

Have you tried taking a vibration measurement whilst cutting to compare the relative magnitude of the vibrations yet?

I’m working my way up. I don’t want to start testing cuts just to discover that there’s a 25% variation based solely on how I seat the collet, causing me to redo everything.

I want to understand the collets to some degree, then I’ll use the most repeatable collets for the cut tests.

I’ll get there, don’t worry :slight_smile:

But maybe I should give it a try with an old endmill just to see what it looks like…

2 Likes

I think it makes sense to try a cut asap.

As Vader says, the ability to measure deflections in a free-spinning collet is insignificant next to the power of the Force (when it’s cutting).

Well, that’s Vader. He was wrong on so many levels, so I might be too.

2 Likes

Okay you cut-hungry beasts, here are the first cuts. I varied the RPM to see what a difference it would make.

Setup: Fahrion GERC11-B 3.5mm collet and a CncFraises FC1DA3008 1/8" single-flute endmill.

Cut parameters: AP 1mm, AE 1mm, FZ 16.08 µm.

Toolpath (outside-in spiral):

Unloaded charts:

30k RPM charts:

24k RPM charts (note: unloaded chart frequency peak):

20k RPM charts:

The really interesting thing I observed is that on the 24k RPM run, the machine audibly resonated, like a tuning fork. It caused the chips to flow almost like water at times. Here’s a short clip.

5 Likes

Nice data,

Is that accelleration measurement still just the Y amplitude? How do the X and Z look?
There’s a distinct periodic change in the vibration, be interesting to see how that’s correlated in X, Y and Z with the cut direction.

2 Likes

This is the overall magnitude of X and Y combined (sqrt(x^2 + y^2)). I could add Z but I’m not 100% sure how to deal with gravity (which is included in the sensor reading). In theory I can just subtract 9.81 but in practice it looks like the average reading differs a bit.

I really should measure the X and Y direction and speed… The periods are due to the changes in stock. The gaps earlier on in the job are from where I cut out a chunk out of the top right corner of the stock I’m using for something else, so the cycle is:

  • Gap
  • Cut from top to bottom along the right edge of the stock
  • Cut from right to left along the bottom edge of the stock
  • Cut from bottom to top along the left edge of the stock
  • Cut from left to right along the top edge of the stock
  • Gap

So the big peaks you see are from left to right along the top edge (which is also where I heard the most resonance on the 24k RPM cut), followed a smaller peak for top to bottom and then the other two cuts are fairly calm.

One thing it’s probably worth trying is mounting the stock in the middle of the bed. Currently it’s mounted in the bottom left corner.

2 Likes

Interesting.

It seems that there’s quite a bit of difference in the vibration due to the cut direction, which I saw on my Shapeoko as well due to different resistance to deflection in different directions.

Have you plotted the X and Y separately on the same time axis?

Might be worth plotting just one lap of the workpiece for each to see what’s happening in each direction.

Do you have a plot from Millalyzer or similar to indicate that the force breakdown from the cutter is expected to be?

Also, is that matplotlib you’re using?

1 Like

Good ideas! Here are single laps:

20k RPM:

24k RPM:

30k RPM:

These are so different I have no clue what’s going on.

Do you have a plot from Millalyzer or similar to indicate that the force breakdown from the cutter is expected to be?

Of course, something like this:

Yep

2 Likes

Oooh,

That data is really interesting, definitely want to see what @gmack and @spargeltarzan think.

Interesting how the Z vibration jumps up at the 24k speed, maybe this resonance is a vertical deflection of the spindle? And then the huge doses of Y vibration as the cut feeds forward and backward in Y at the 30kRPM speed.

I think I’m gonna have to build myself one of these for my Shapeoko.

BTW, have you tried Plotly for charting? If you’re interested I could put together some plotly line charts for it, you can interactively zoom and generally mess about turning series on and off etc. Are you running this as a script or a Jupyter notebook type app?

2 Likes

An interesting theory, any idea how I might test it? Changing axial depth of cut maybe?

Let me know if you need anything.

By the way, one interesting idea for folks using a Raspberry Pi for Carbide Motion (can’t remember if you’re in that thread) might be to connect the accelerometer directly to the Raspberry Pi’s GPIO headers.

I’ve tried Bokeh and Plotly but for quick hacks like this I always come back to Matplotlib.

This started as a Jupyter notebook but I turned it into a script that saves a PNG so that I can process the charts as part of the same script that collects the data.

My workflow now is basically just python cnccollect.py input.nc output.log and it loads the G-Code into my controller, starts the job, collects metrics while waiting for the job to finish, then shuts down and processes charts.

My wish for a new graphing library would be the ability to update the plots in realtime, as the job is running.

1 Like

Cool! Very nice work! Obvious next thought: Does the controller’s API allow to command a dynamic feed/spindle override? :wink:

Regarding gravity: Yes, you just substract the contribution of 9.81*[dx, dy, dz] where the vector is the actual orientation of the gravity direction in the frame of your accelerometer (the chip, that is, not the board). It’s unlikely to be oriented precisely vertically, hence it’s not just Z. To find g*[dx,dy,dz] just average the reading at rest.

Next, I’m not saying you’re doing anything wrong; just warning for a trap I’ve fallen into myself earlier:

Since you’re looking at relatively high-frequency excitation, you may want to configure the filters for the 20649, it’s in table 17 on page 67 of the datasheet. Perhaps set ACCEL_FCHOICE = 0 and ACCEL_SMPLRT_DIV = 0, because otherwise the high-frequency contributions are just clipped off. This will also increase noise, unfortunately, but if your signal is large enough (3 g definitely should be) you’re still better off.

The reason for this: Assume that the motion you’re interested in is a superposition of many harmonic oscillations, each with different amplitude and frequency:

image

then the acceleration is

image

meaning the high-frequency components of motion contribute a lot to accelerations because of the squared frequency. The filters in the accelerometer have the effect of strongly scaling down anything above their bandwidth, so the result after the filter can look much lower than the acceleration really is.

4 Likes