Yeah, good point. I’ll make sure to do that next time.
By the way, any thoughts on the gyro? I’m guessing the spindle isn’t just being deflected linearly but a torque is being applied as well. I wonder if it makes sense to look at that?
Caught that early because I was promised a 4kHz sample rate and only got ~3k IIRC. You only get the full sample rate if you use the settings you mentioned.
Yep, at this point I think taking more cuts at different depths and widths to build up some test data is the order of the day. We can have all the theories we like but without the test data they’re shooting in the dark.
I may come and ask for the Arduino sketch to get me up and running.
Yep, following the CM on a Pi thread, that’s good work Rob is doing. Is the Pi going to be able to sample as fast and on a reliable time interval? I’d assumed the reason for the Arduino was to do the fast, regular time interval sampling and hand off to the Pi for asynchronous work?
I may have missed it but, what sender are you using? Is your Python reading the gcode?
Aha… Have you looked at plotly dash?
It is plotly, with callbacks to Python, in a Flask web server so you can just post updates to the data objects in Python and have plotly do the graph updates in the served web page. I’m using this for a bunch of analytics at the moment with async updates of the output.
I think it might be rather good to show on a local display a current reading (a few seconds in a weighted moving average probably) for X, Y, Z and then have the option to watch the time-series data in a browser page. Maybe the Arduino could drive the current reading display?
I’m using a Teensy rather than an Arduino but I’m not sure how challenging a 4kHz sample rate is. The Raspberry Pi has a clock frequency of 400MHz so I’d expect it to be able to keep up no problems. I might try it out a bit later and see.
I only used the Teensy because I needed something to translate SPI to something my PC could work with.
My controller doesn’t operate over serial like Grbl so I don’t have a “sender” as such. The host-side controller software is responsible for reading, processing and acting on the G-code. My Python code just instructs the control software to load the file and start reading it, it’s not feeding any G-code itself.
I saw it when I was looking at Plotly earlier but I’m not too sure how applicable it is for this problem. I use Grafana for general monitoring and plotting needs and it works well enough.
The issue with this particular application is that the data are such high frequency. In CSV format, they easily reach a few hundred MB for a single cutting job, for example. Not all tools are capable of dealing with that well. My existing Python script is already pretty slow and I can’t imagine that adding in a web server and Javascript-based plotting library would help things.
I’m more interested in the other end of the spectrum. I ran across VisPy recently. One interesting part there is:
Notably, VisPy now ships a very basic and experimental OpenGL backend for matplotlib.
It actually looks like it’s pretty close to that. If you rearrange equation 12, it’s basically: v = (2*pi*freq)/a.
I’ll see if I can plot that in my next batch of measurements.
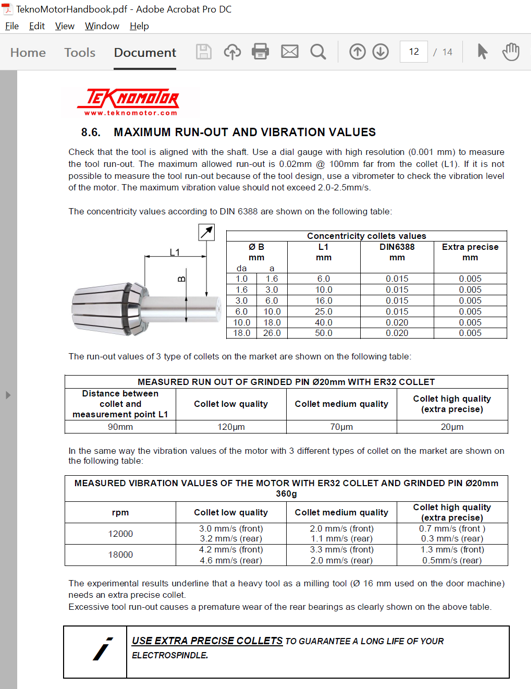
Speaking of vibration and collets and whatnot, I have a fun bunch of new collets and balanced nuts to play with.
I’ve been looking at your data again and I’m not seeing the correlation I had expected between the Millalyzer forces and the accelerometer data. Are you sure the X and Y axes are correct?
The Millalyzer plot suggests the main force is transverse, not in the feed direction, however in the plotted data, taking the 30kRPM plots, assuming I’ve read it all correctly, the top to bottom along right edge and bottom to top along left edge show the very large Y accelerations whilst the left to right and right to left cuts show larger X vibration.
I would have expected to see the large forces in transverse rather than feed. I was also looking to see what Y, Z coupling was visible due to the spindle deflection pivoting about the Z carriage to X rail attachment point and that’s not correlated, instead I’m seeing an X, Y coupling which confuses me.
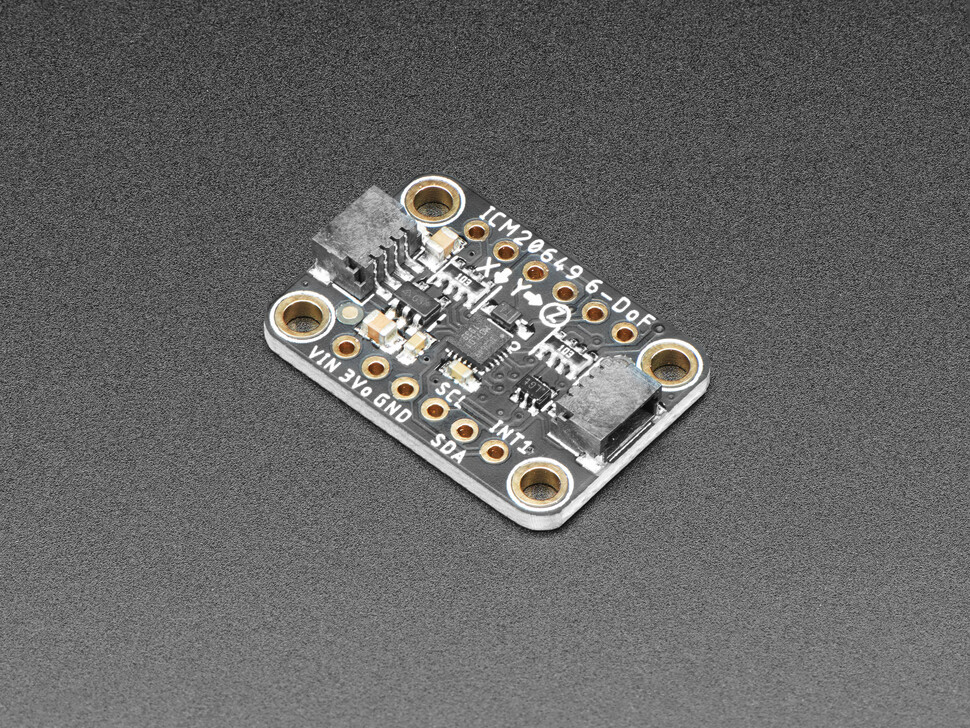
The breakout is mounted such that lengthwise, it’s parallel to the machine’s X-axis, so as you can see from the picture of the breakout board, the accelerometer’s X axis is parallel to the machine’s Y axis and the accelerometer’s Y axis is parallel to the machine’s X axis.
So the readings are swapped, as you suspected.
The underlying reason is that I just plotted accelerometer X, Y and Z and didn’t give any thought to the orientation of the accelerometer relative to the machine.
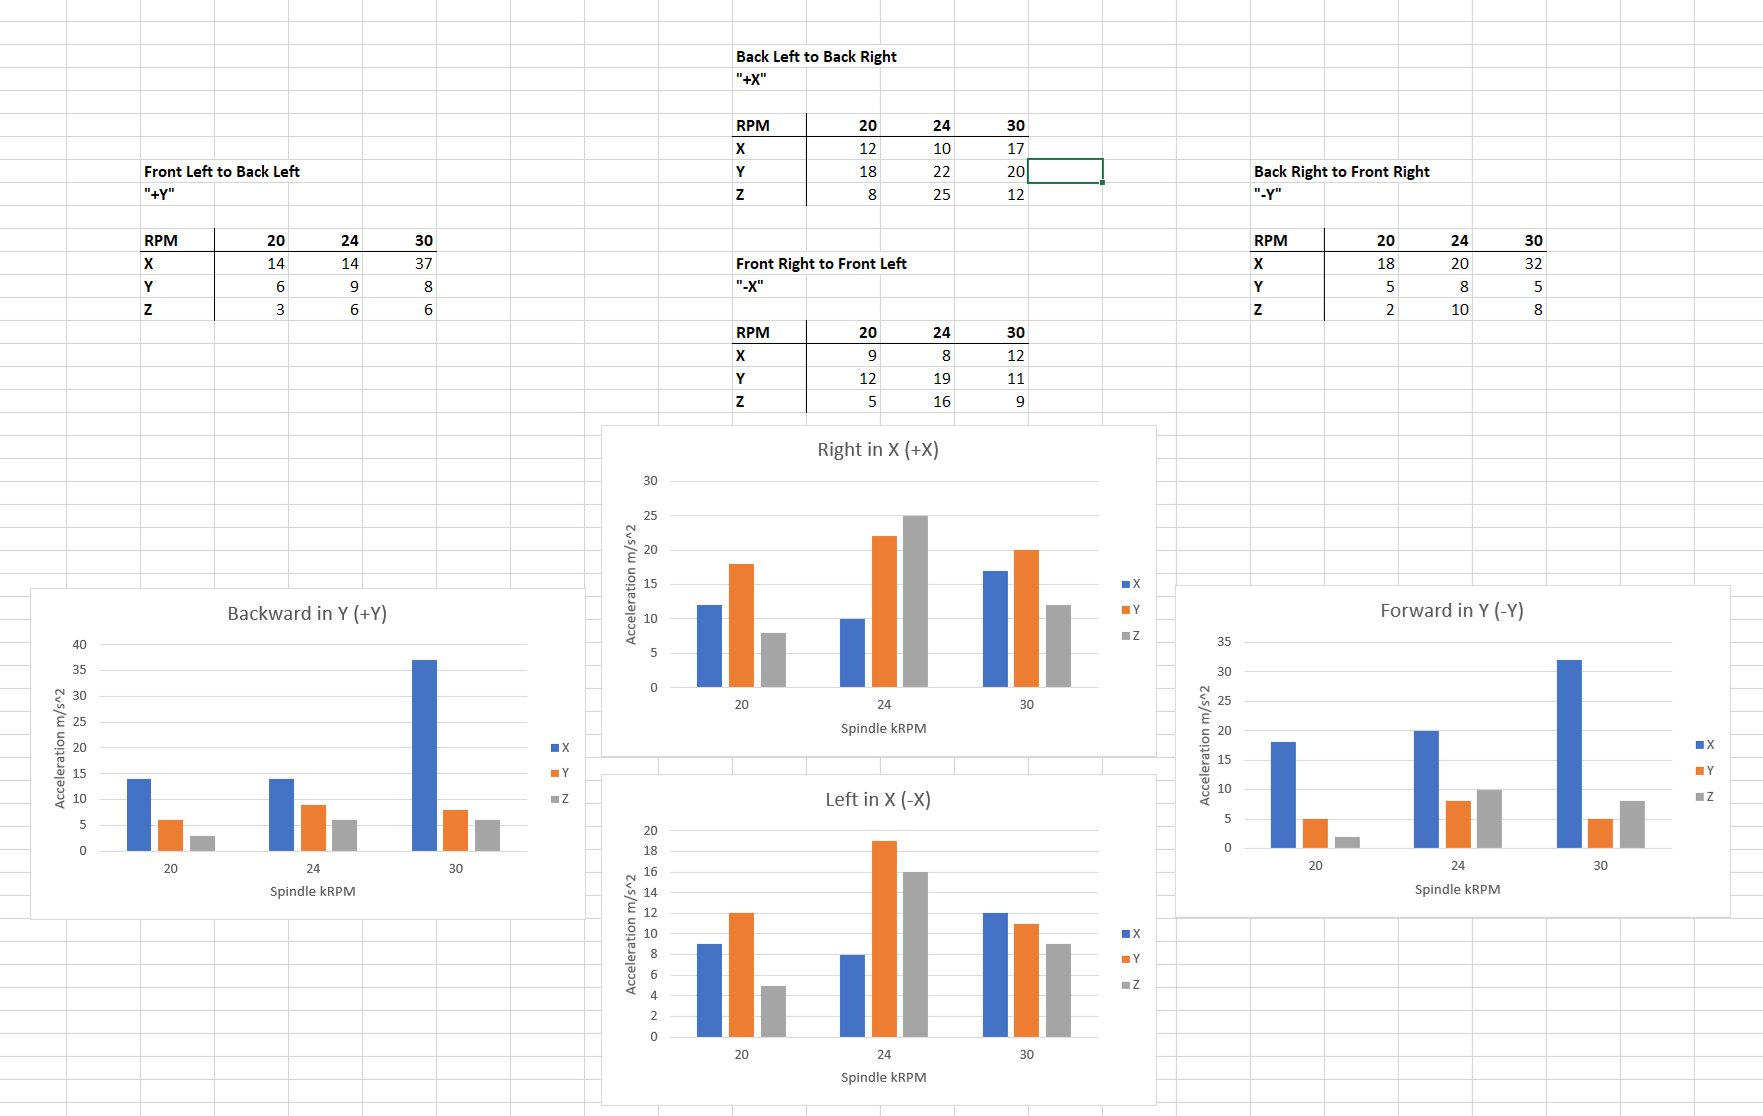
I went through and roughly grabbed averages of the accelerations (minus gravity on Z) for each pass direction (+X, -Y, -X, +Y) and spindle speed (20k, 24k, 30k) and plotted those to see what stuck out. (I think graphically, not numerically).
We should bear in mind that these values will likely be quite specific to this cutter, DoC, WoC and target material, we don’t know how these values translate to other cuts, which of them are machine frame generics and which are cut specific (yet).
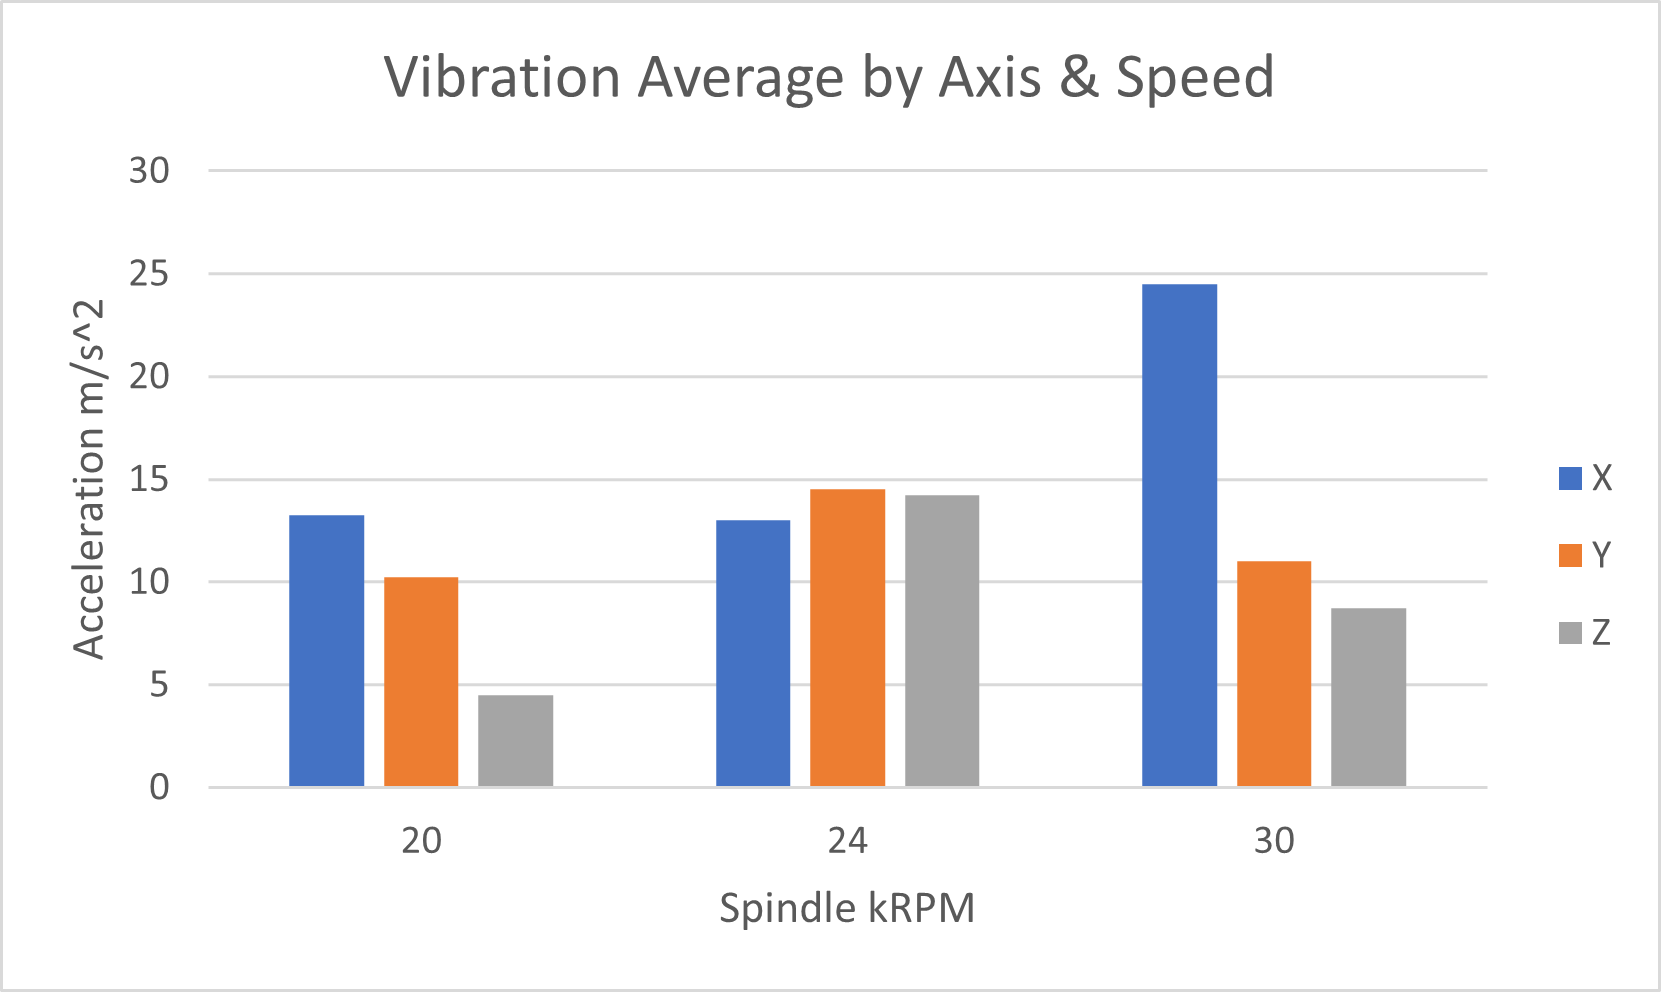
Here’s the X, Y and Z eyeballed averages plotted for each pass direction, X in blue, Y in orange, Z in grey.
There’s a few things that stick out of the data now (assuming I have not made any silly errors which is quite possible)
Bearing in mind that the majority of the cutting force in this cut is sideways to the cut direction (thanks Millalyzer) -
Fore and Aft movements in Y are really setting off your X vibration, it would be very interesting to take readings on the vertical plates at each end of the X rails to see if this is backlash on the screw or just frame deflection. It’s particularly horrible at 30kRPM, this may be a resonance in the frame (or anti backlash nut?)
Left and right movements in X set off a Shapeoko like spindle ‘nodding’ movement where the whole Z carriage seems to be rotating around the X rails with combined vertical and fore / aft deflection. This seems to be close to resonance at the 24kRPM speed, which fits with your speed ramps measuring the collet.
20kRPM seems to be a strongly preferred speed for the machine, overall vibration is much lower, in particular Y, Z nodding is well controlled, see graph below.
This next graph is just the average acceleration for each axis in all four directions at each RPM.
The X axis is the main offender here (leadscrew? end plates?)
24kRPM gets them all going well
30kRPM sets off X horribly and should be avoided for this cut
From these I think it would be really interesting to see
The data for the same cut at a few different places on the machine (the vertical plates at the ends of the X rails for startes).
The data for a different DoC and WoC
The data for a different size cutter (cutter and stickout both have a big effect apparently)
The same cutter and cuts with some additional mass added to the spindle ( I was thinking for a while of a heavy ring around my spindle with a sorbothane coupling ring to try to absorb vibrations)
If you want, I’m happy to send you the raw data, though it might be worth waiting a bit, since I’m rewriting all the data collection infrastructure in Rust and hope to start using a binary format for the data since my CSV-like format ends up enormous and bogs everything down.
Hmm, how about one on an X-axis support column and one on the back of the X-axis itself?
I need to figure out how to attach them though, I don’t want to do anything permanent (e.g. drilling or superglue) and double-sided tape doesn’t stick well to the Nomad.
Different size as in diameter, length, or both?
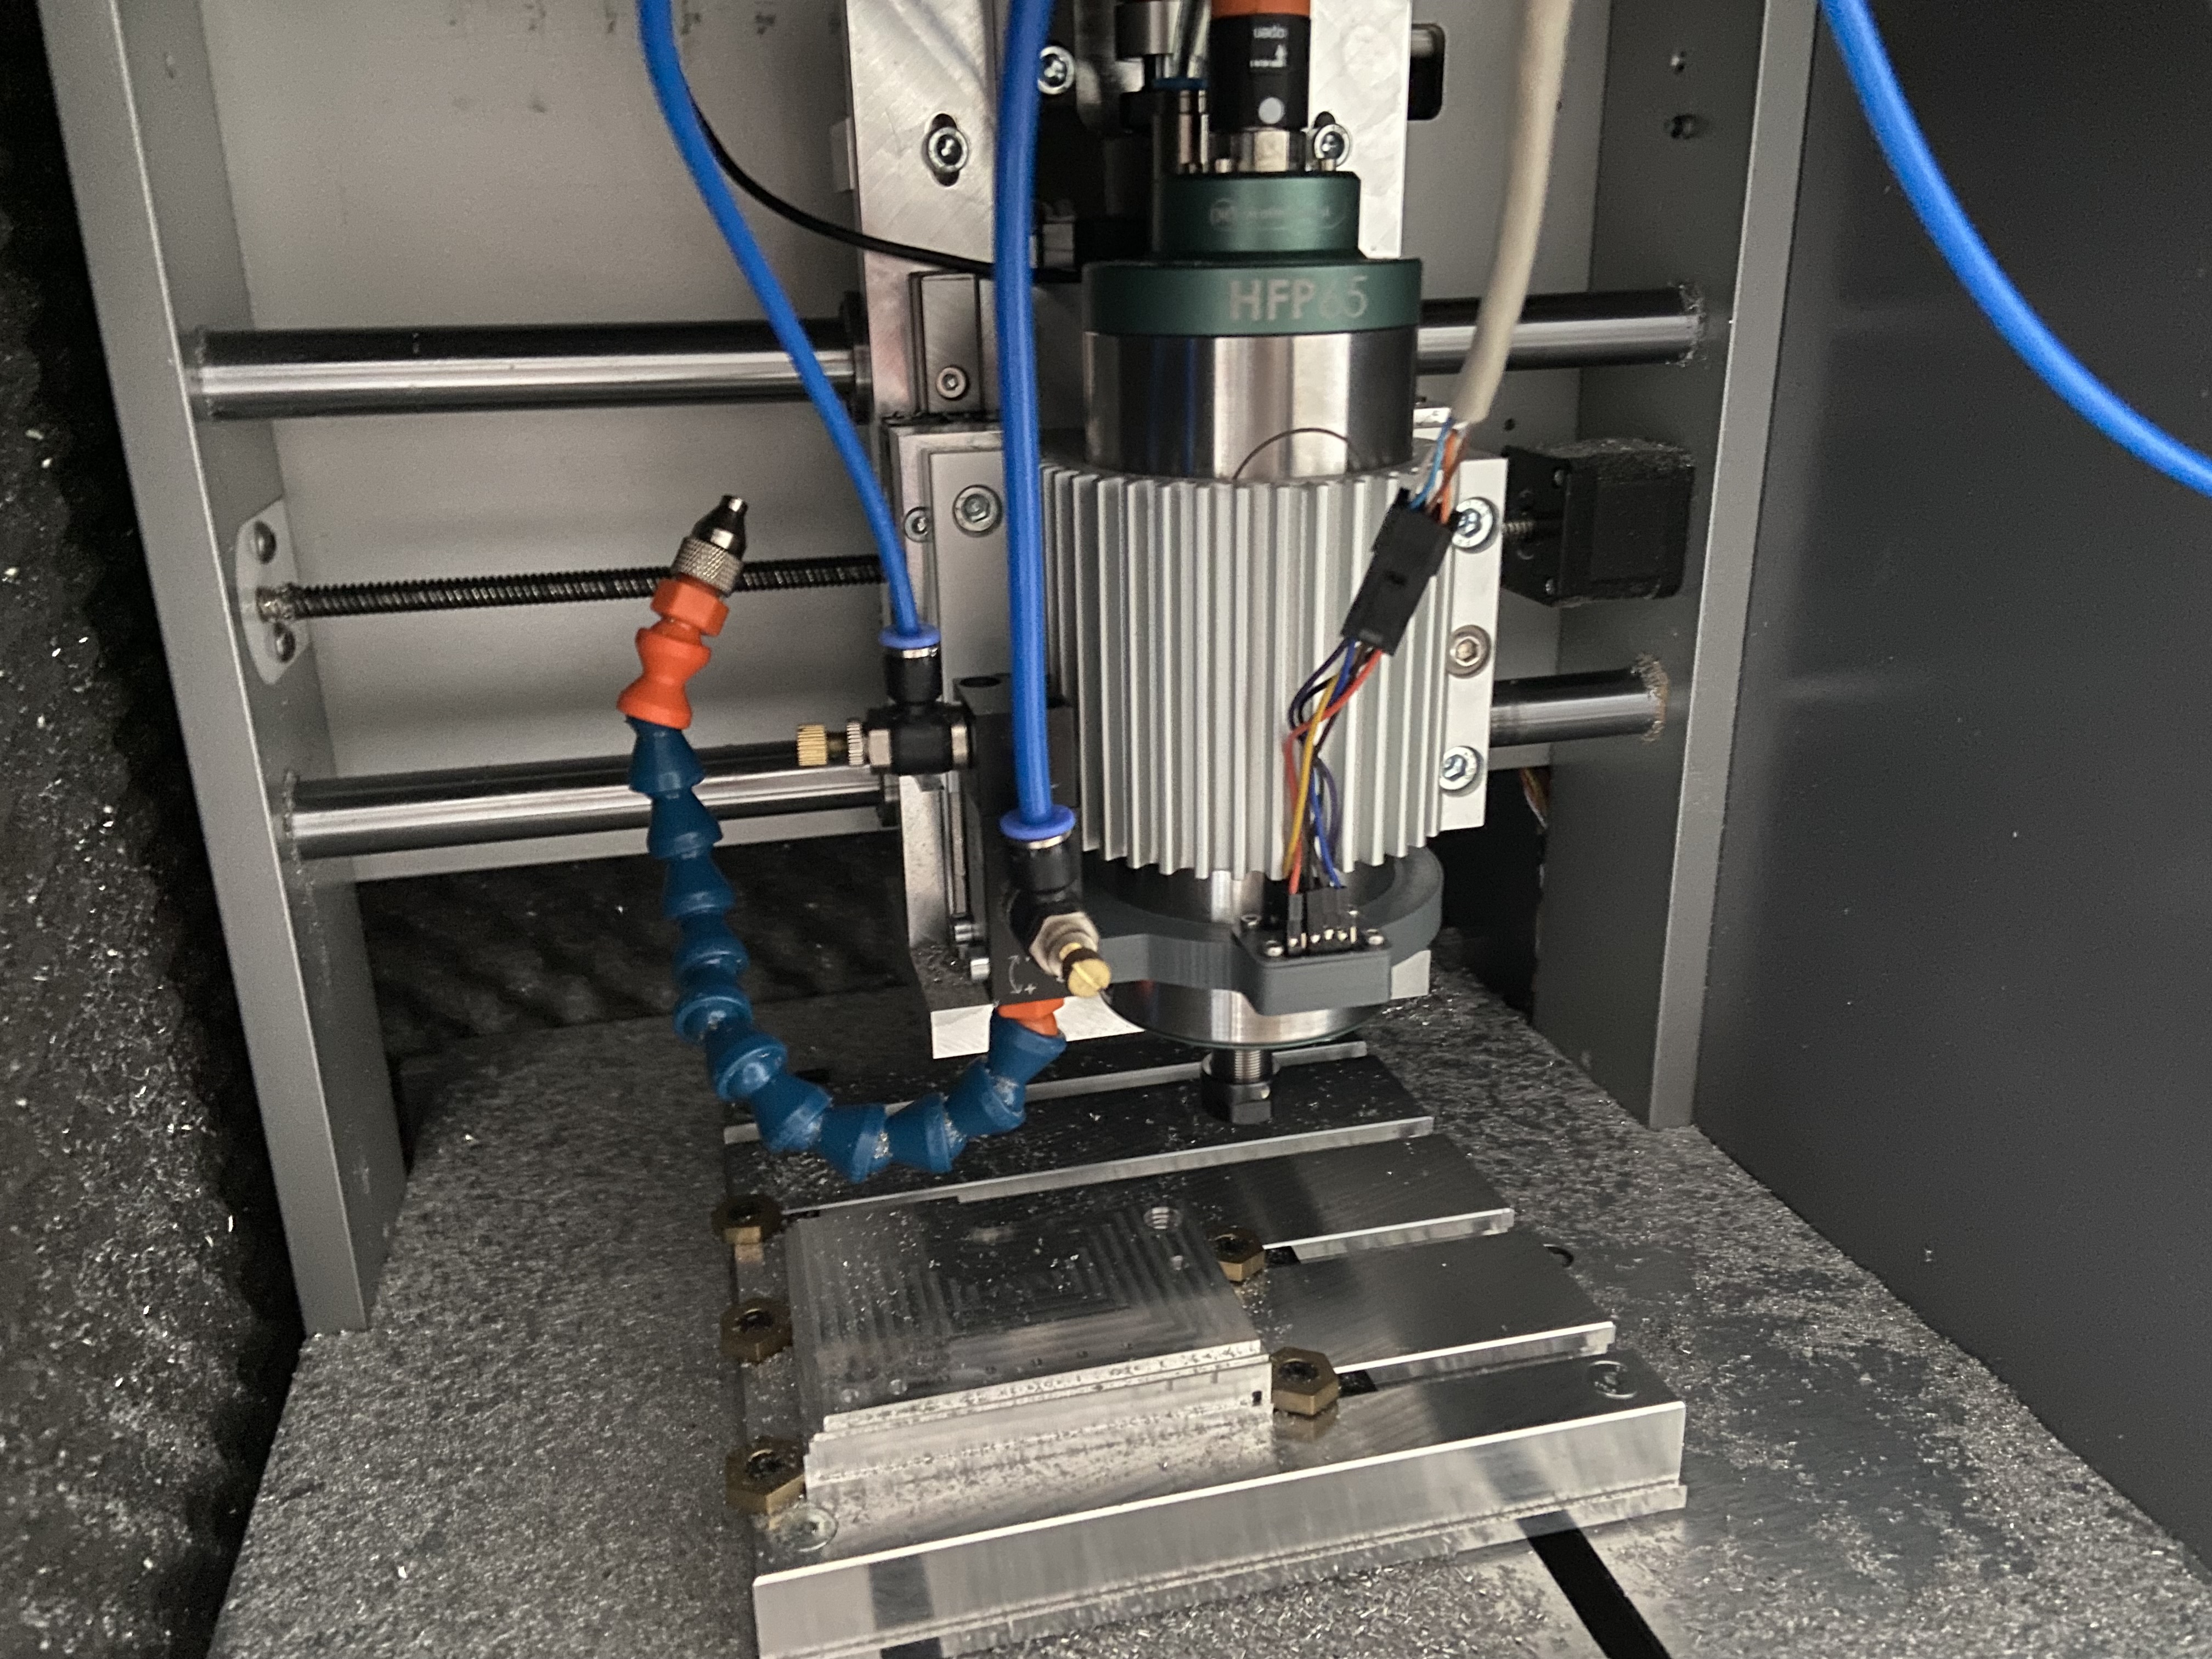
There’s not a lot of real estate for attaching things to the spindle unfortunately. The bottom clampable area is already occupied by the existing accelerometer/coolant collar and the top clampable area can’t be used otherwise it gets stuck between the spindle holder and the Z-axis ballscrew/stepper coupling assembly.
Another expected aspect which seems to be supported by the data is axis / transverse interaction.
Looking at the Millalyzer plot we see that there is around 4N of vertical force in the cut and around15N of transverse (in plane) force.
Looking then at the Right (+X) and Forward (-Y) cut directions we see Z acceleration being notably higher than Y acceleration. However then looking at Left (-X) and Backward (+Y) we see that Z is notably lower than Y.
In the large deflection left / right on X we also see that the Y accelerations seem to be lower when moving left than right.
If the movement is the Y/Z coupled ‘nodding’ of the spindle around the X axis this is the sort of behaviour we would expect as the axial forces on the spindle either reinforce or counteract the nodding induced by the in-plane forces.
It will be interesting to see if this shows up in more data or is just an artifact of this particular test.
I think this data has done it’s job and pointed us toward the next set of tests now.
Have you considered sending the data to Redis or similar?
Are you doing any processing in real time (such as the conversion to frequency domain) or just storing it and processing later?
The thing to look for, I think, is whether the vibration is coming from the Z carriage vibrating on the X rails and screw or whether the entire X system is vibrating back and forth. In reality probably both of these things are happening, at different frequencies and with different Qs.
As for attachment, there’s always acetone to remove superglue or hot-glue…
Both I suspect, but I’ve only read about doing the lobe stability tests.
Thinking a little more (and remembering some of the things Spargeltarzan explained to me about the Shapeoko measurements) there are two sets of vibrations going on here, machine vibrations and cutter / workpiece vibration. On the Nomad / Shapeoko grade machines the machine vibrations tend to dominate.
That being the case what’s probably a decent approach is to find the machine resonance modes and then figure out how to avoid those when generating CAM.
You’ve already seen some indication with the spindle only measurements, it might be worth deliberately unbalancing the collet nut with some bits of tape or similar and running that speed sweep again. You know what accelerations the machine sees in cutting now so staying away from ‘break the machine’ accelerations should be easy enough. With the unbalanced spindle data separated into X, Y and Z it should be possible to find the major resonances in X and Y/Z for the machine so those can be avoided.
It might then be worth confirming those in some test cuts, doing the square as you have been but with a change in spindle speed (say 500 or 1kRPM) each loop.
It would also be interesting to see the data transposed into the frequency domain (for each cut direction and duration). If you’ve got 4kHz sampling then that should be able to give frequency domain data up to ~ 1kHz which would allow for a 2 flute cutter at 30kRPM. This might well tell us more interesting things about the machine resonance modes.
If I remember correctly the Nomad moves the workpiece in the Y axis? It might also be worth sticking the accelerometer on the Y carriage to see how much that is shaking around too.
Once the major machine resonance modes are known (and plotted) that would give a good set of target flutes * RPM numbers to avoid when doing the CAM.
I’ll try and sum up my response as bullet points, not because I’m trying to be overly concise but because otherwise my posts end up looking enormous:
Regarding Redis or similar, I’ve thought of trying TimescaleDB but I want to put the data somewhere where I can easily do an FFT and I don’t think any of the databases can handle that. For now I’m storing all the data (now in binary!) and processing them later. I just finished rewriting the collection code in Rust and putting a ring buffer on the Teensy to deal with the tiny USB/serial buffers it has on-board. I now get a pretty consistent 4.150kHz sample rate, yay!
I think I’ll put the “measuring different parts of the machine” discussion on the backburner for now, since the ultimate conclusion really is likely to be “replace leadscrews or shafts with ballscrews or linear rails” and I’m not ready for that just yet. That said:
I’d bet the Z-axis carriage isn’t the source of vibration. It’s on preloaded linear rails and a ballscrew so it’s the most rigid motion system on the machine. My bet is on the X-axis (which, like most of the stock Nomad motion components may as well be made of jelly) or the plate that holds the Z-axis rails, which is only supported at either end.
Adding an accelerometer to the Y-axis isn’t as much of a problem as X but it’ll take a bit of time to design and 3D-print an enclosure to mount to the bed.
I’m not familiar with Acetone, would using it to remove hot/super glue not damage the PCB or a 3D-printed enclosure for it?
Regarding the idea of unbalancing the collet nut, I can do that easier by comparing collet nuts. I have various ER11-A nuts, some balanced, some not.
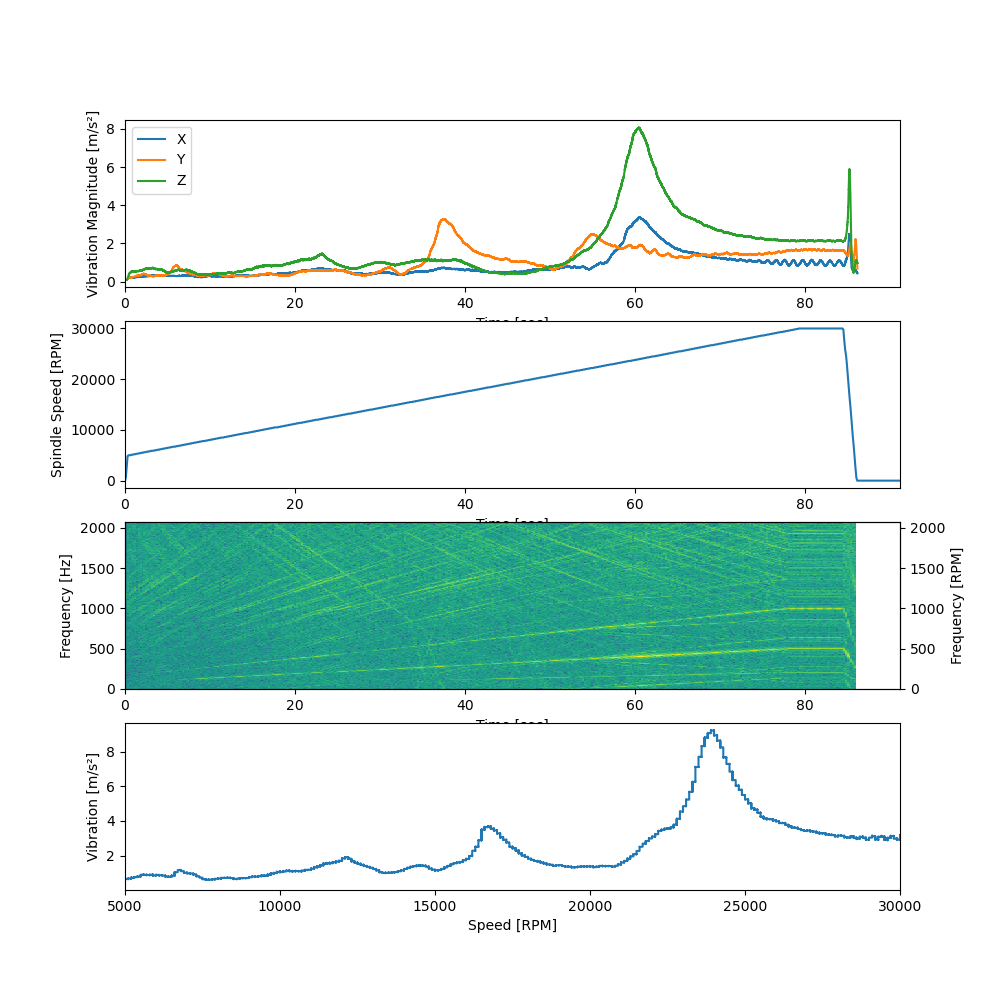
Regarding frequency domain, it’s been in all the charts I’ve posted in this thread in the form of a spectrogram (the green/yellow chart), though it seems there might be an offset of a couple seconds from the other numbers. Also, at 4kHz, I should be able to see everything up to the Nyquist frequency at 2kHz, no?
To be clear, the “major machine resonance modes” are mainly going to come from the cut data, right? And the machine accelerometers don’t matter too much, the spindle should be sufficient?
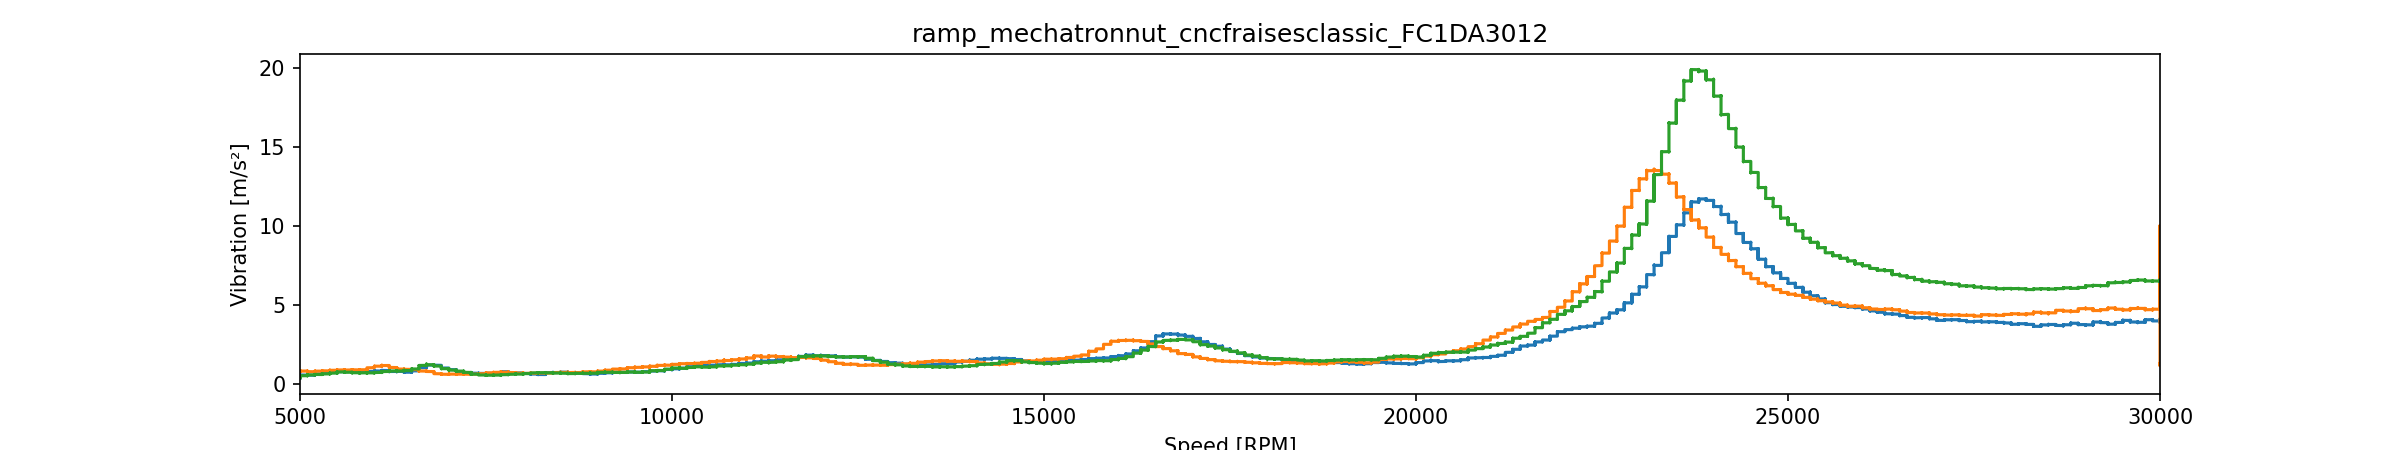
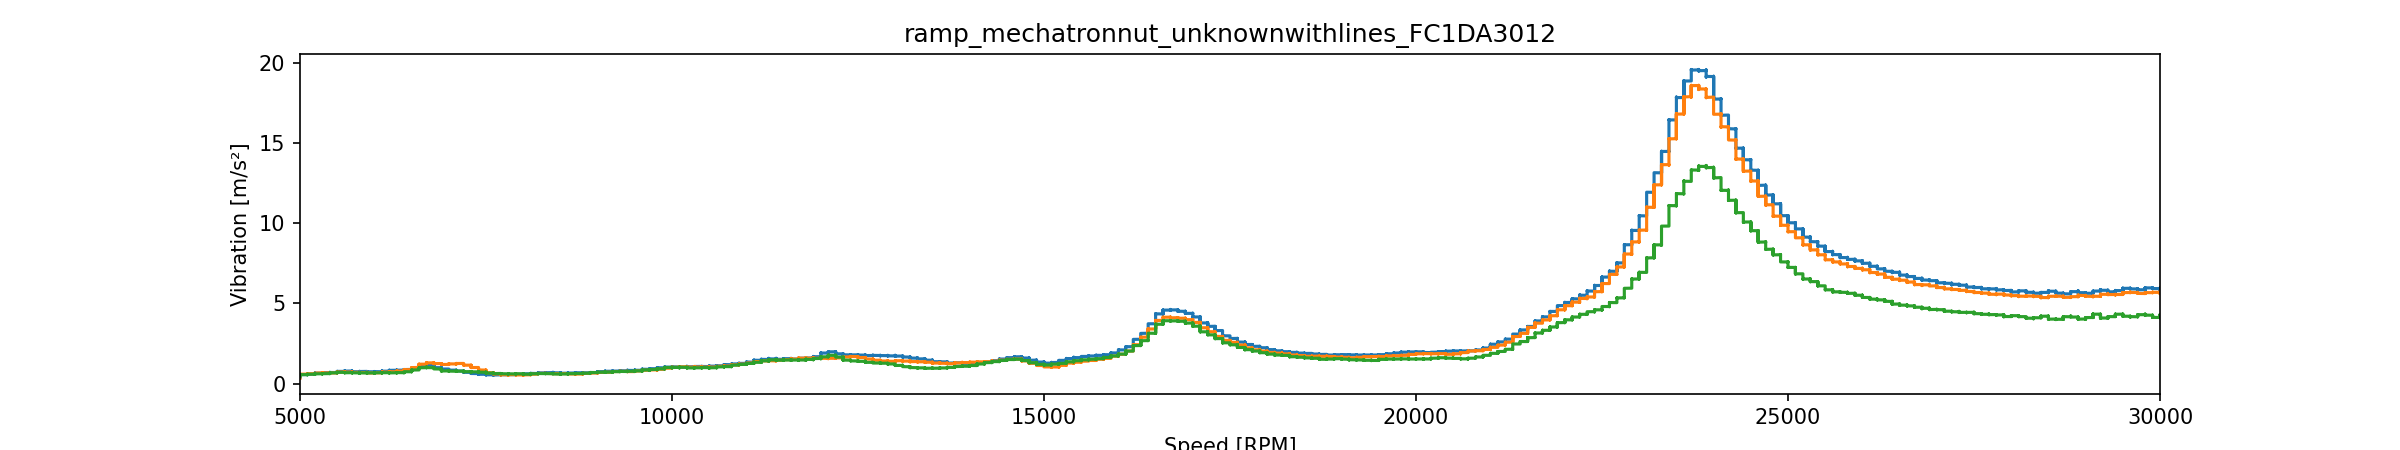
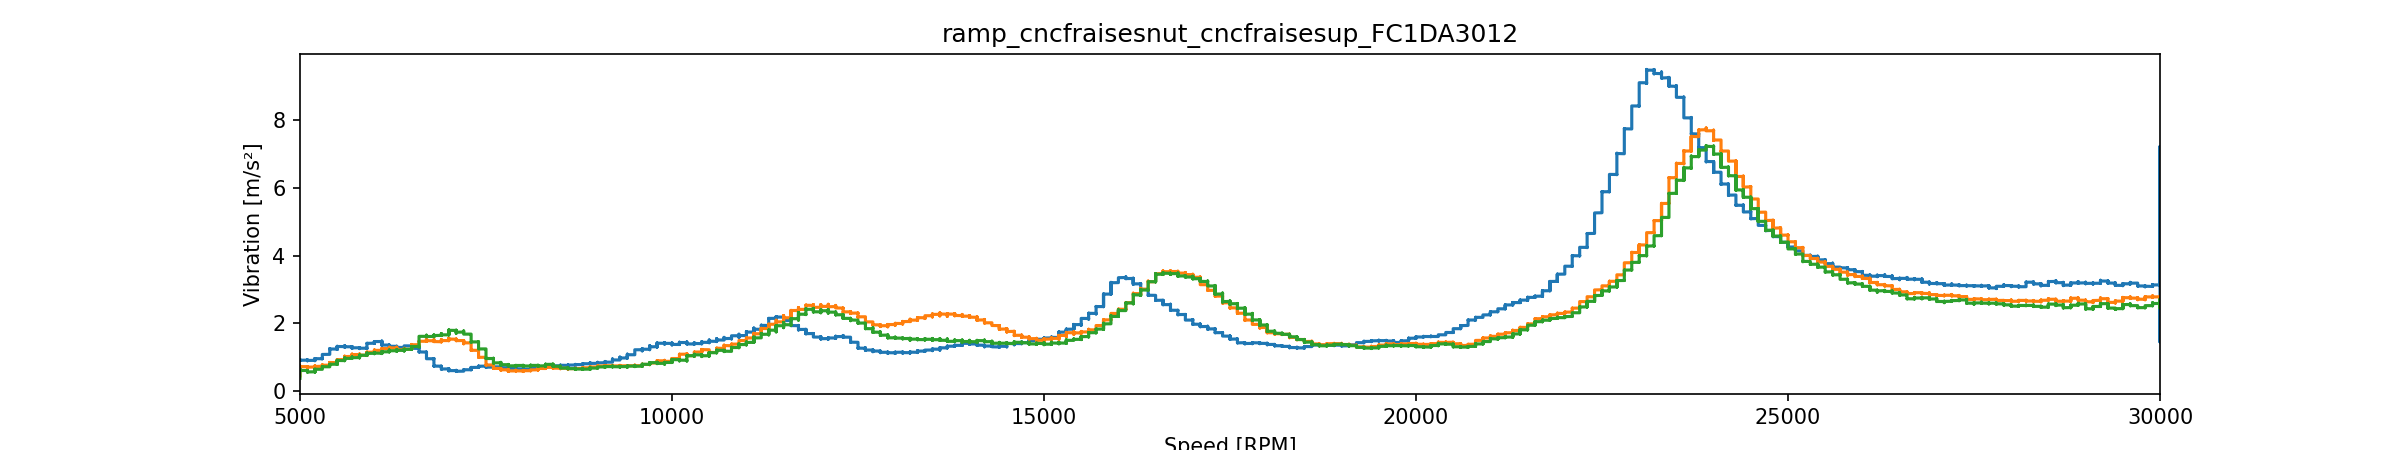
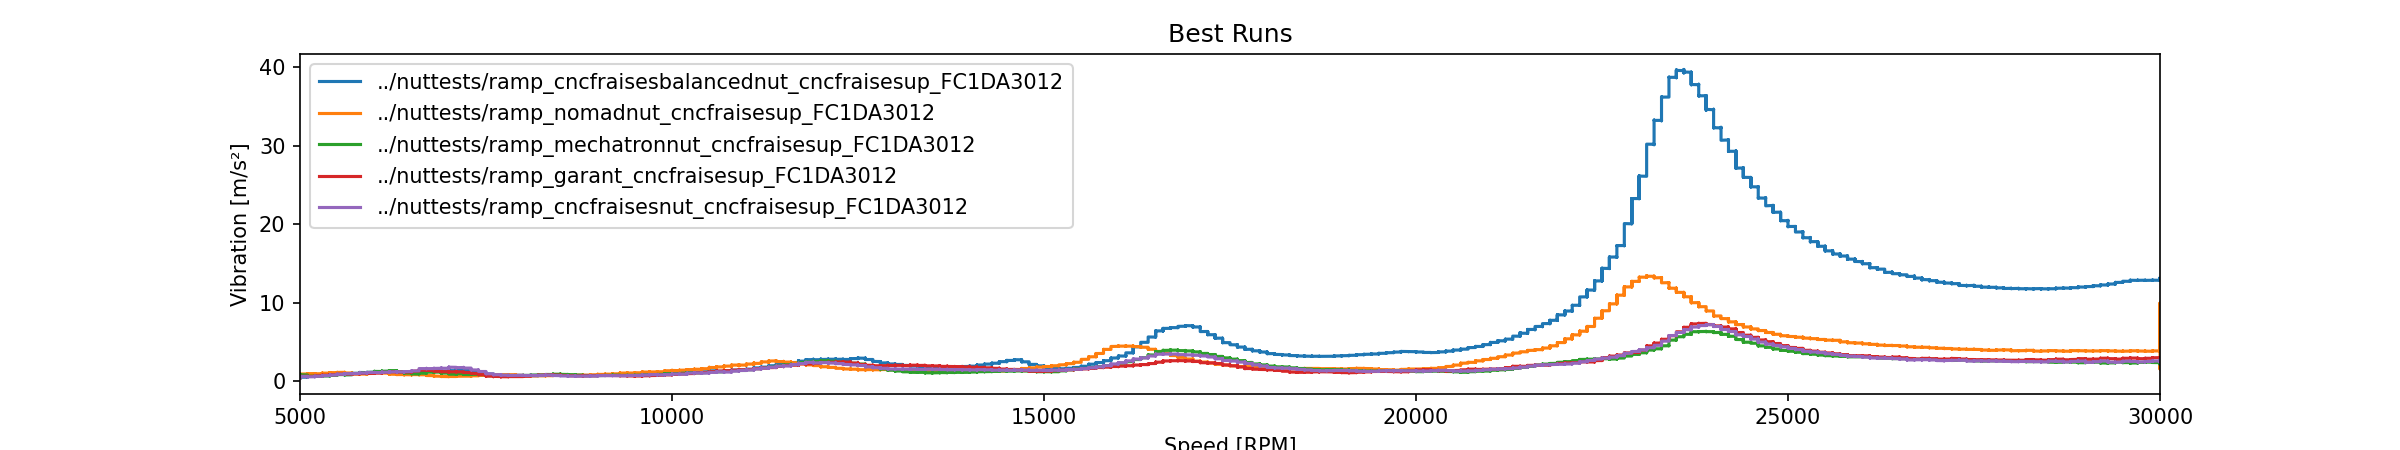
I did tests of collets again, this time with a few repetitions so that I can see consistency and including the Z-axis (after removing a baseline reading to account for gravity).
Between each run, I fully removed the nut and endmill from the spindle, jiggled it around and rotated it a bit and then re-inserted it.
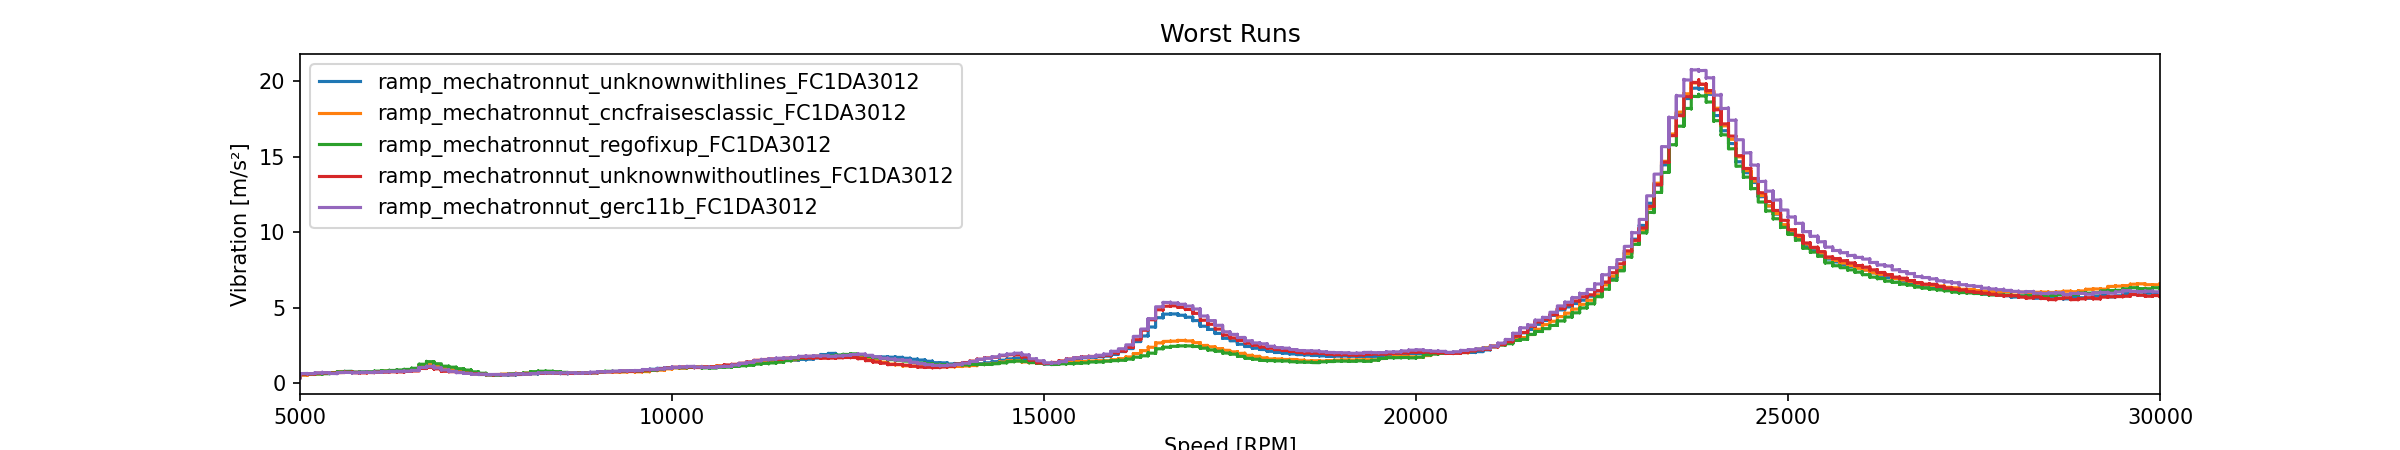
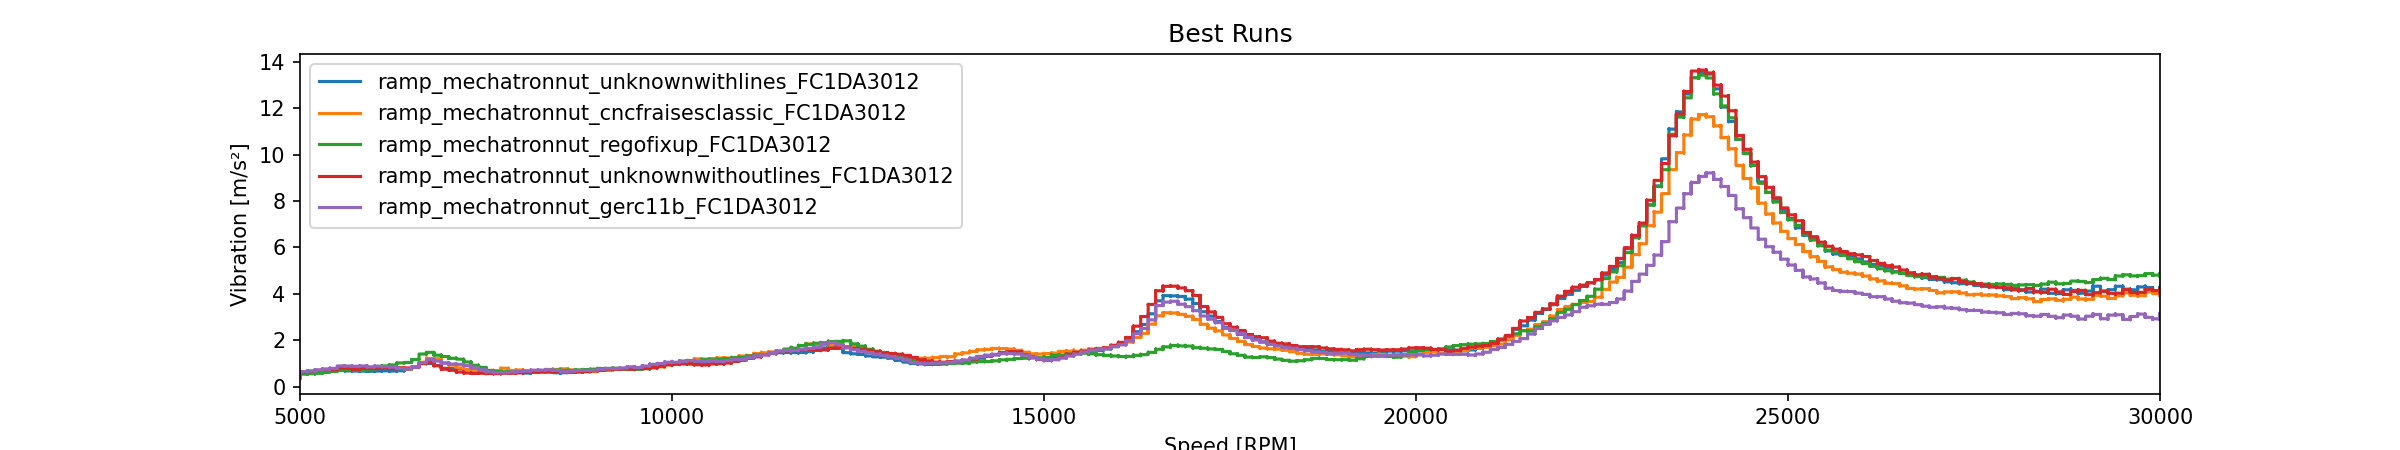
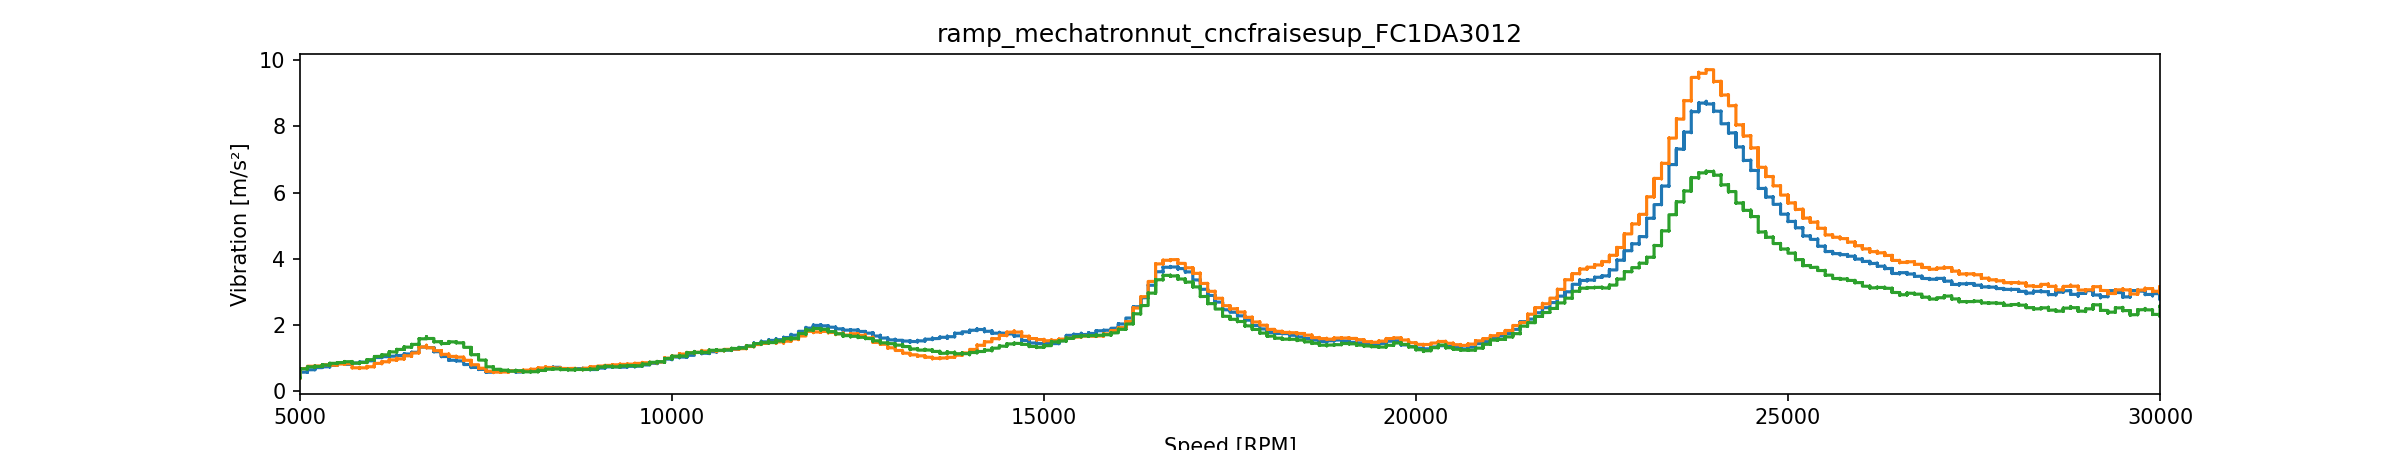
They look very similar but there’s an unusually good outlier I’m not showing here yet.
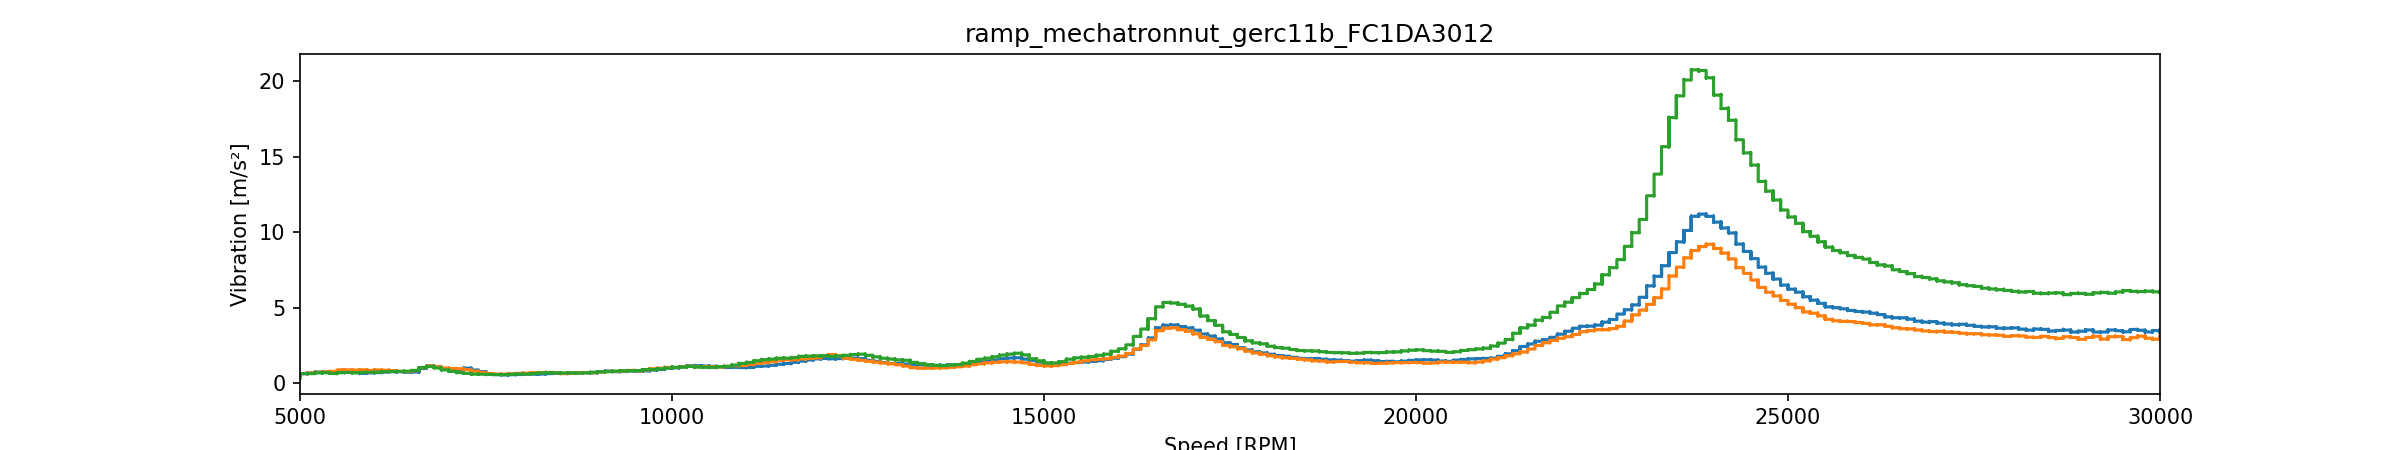
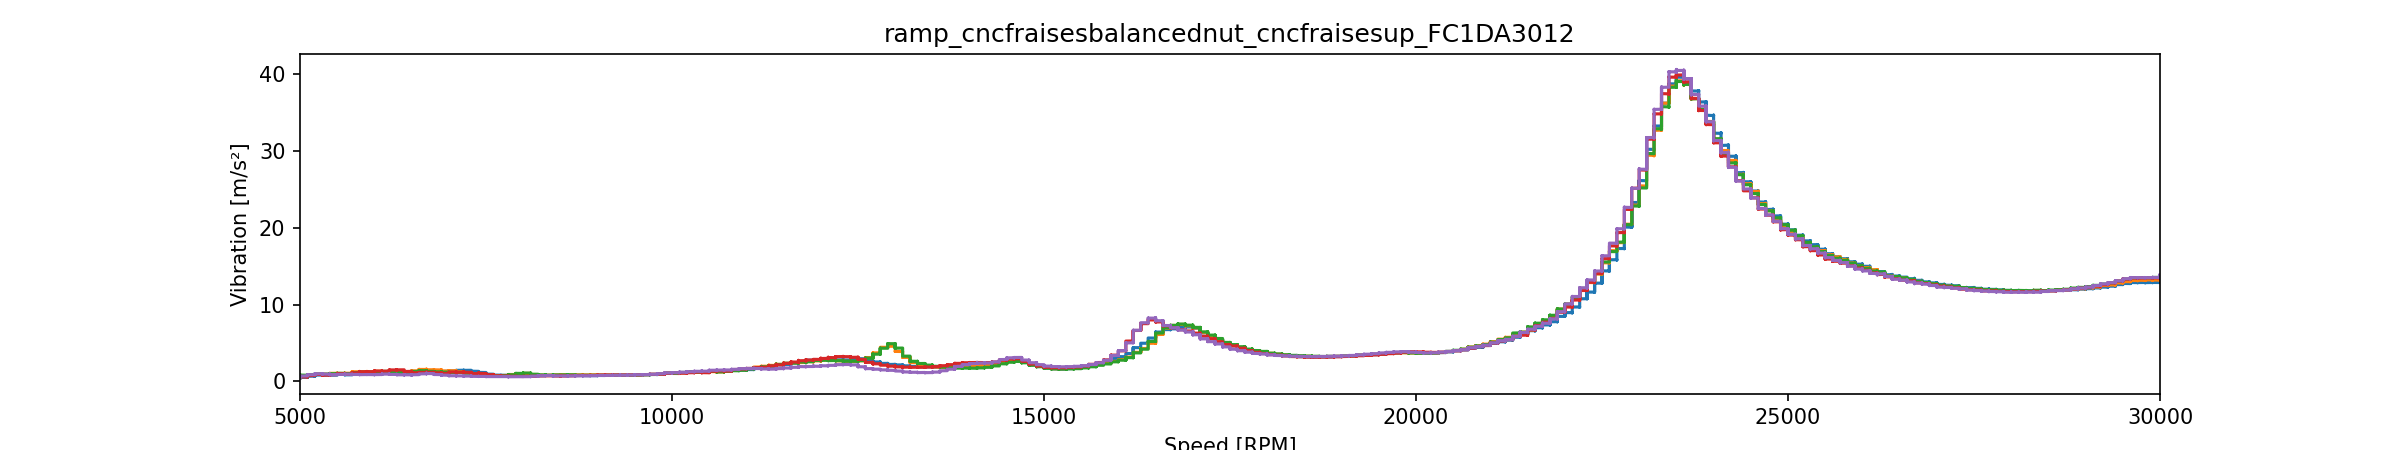
I was really surprised to see that apparently, The Z-axis accounts for the vast majority of the vibration but mostly has one gigantic spike around 22k RPM. Here’s a more complete chart for the best run for the Fahrion GERC11-B:
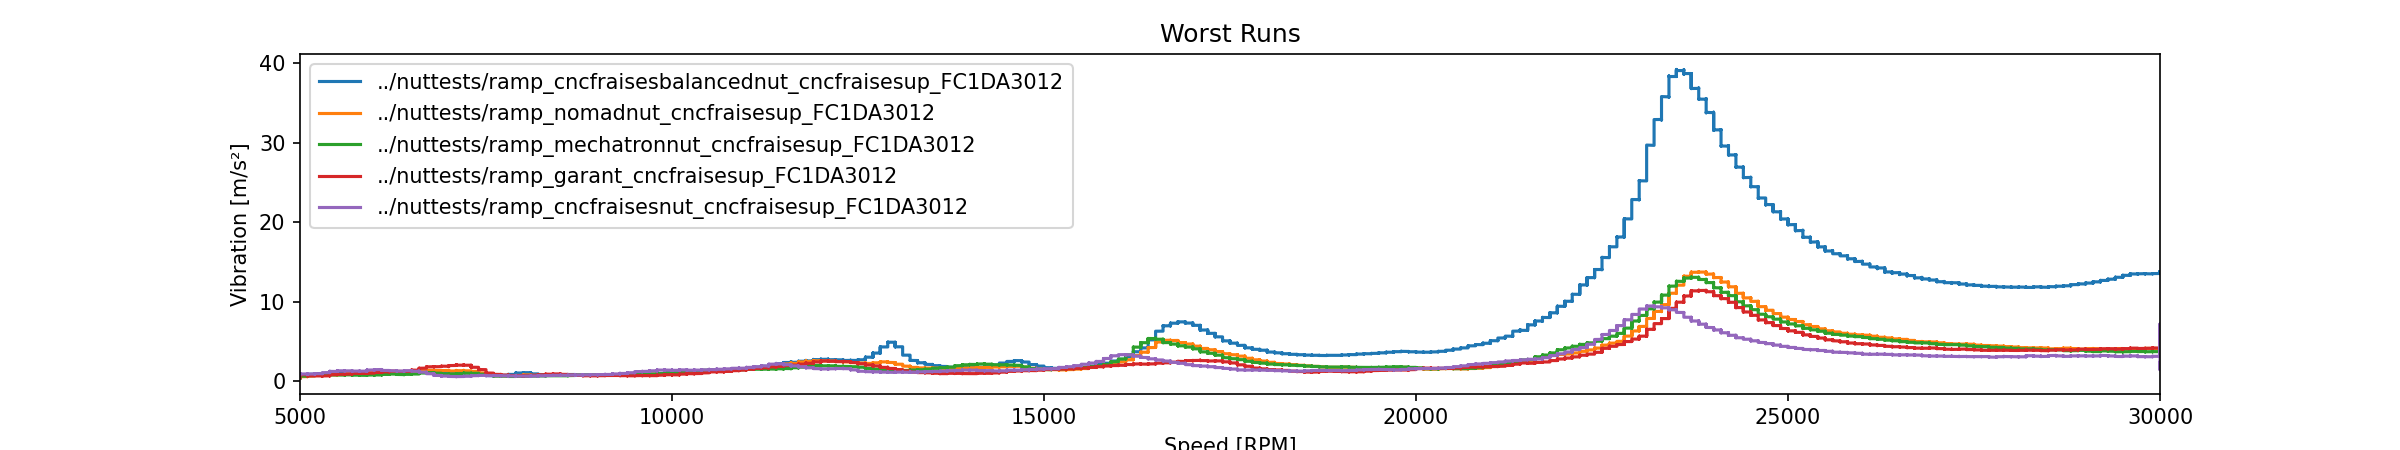
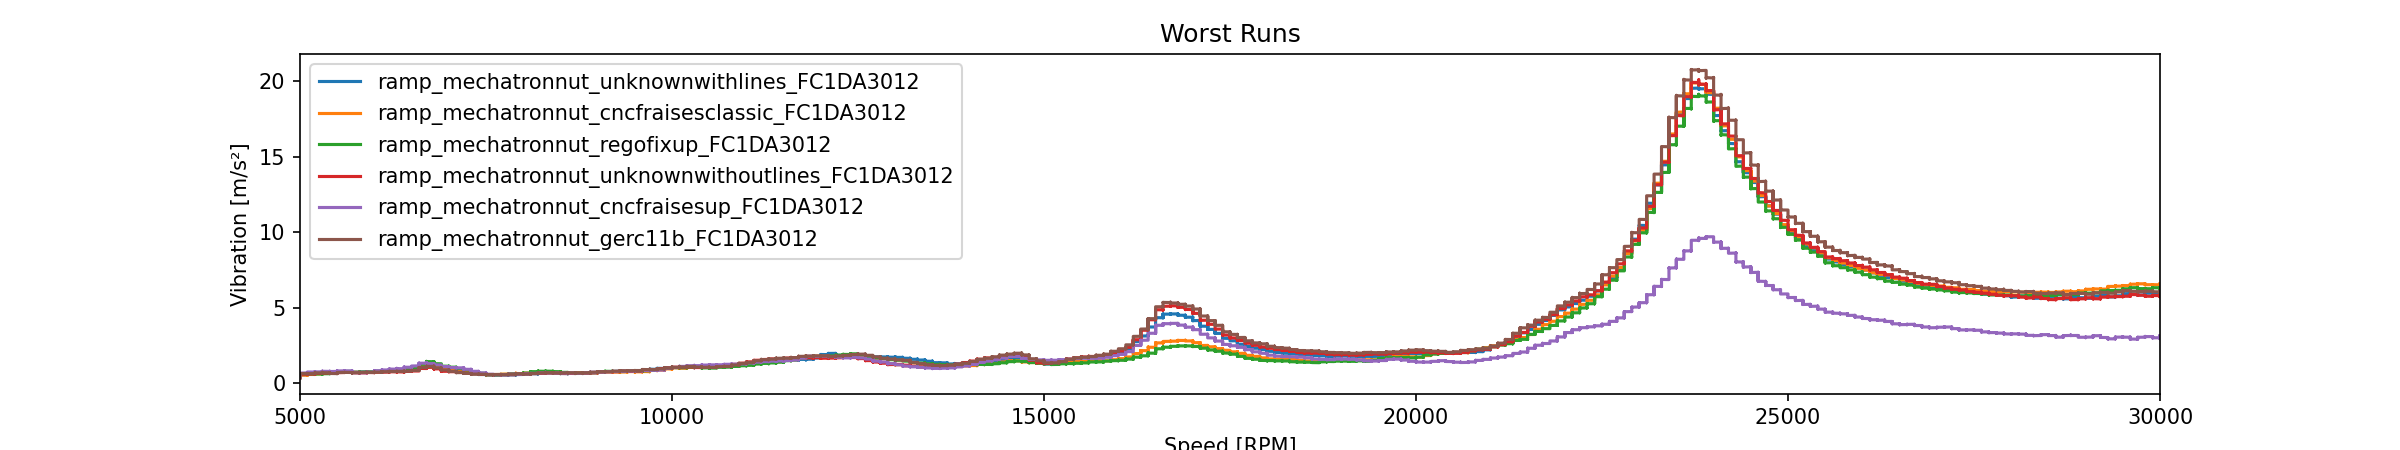
I was also surprised to see so much run-to-run variation, the worst GERC11-B run has twice the peak vibration as the two other runs!. Anyone have any ideas what might cause that?
Something I’ve always wondered: how violently should I tighten the nut? Should it be just enough force that it knows you’re there or should it be basically as tight as you can get it with short hand tools?
REGO-FIX has tightening torques in the technical information section of their Main Catalog and Techniks has them in their “TECHNIKS CERTIFIED COLLETS & NUTS” catalog.
The 3D printed mount for the sensor has more material in the X direction than in the Z direction. Is it possible that the plastic itself is moving up and down at those high speeds and amplifying Z?
Another possible cause is that any serious vibration in X (or to a lesser extent Y) might cause the sensor rotate in a small arc in X or Y because the assembly is fixed at the bottom but free at the top. So like the tip of a metronome as it goes left and right, it also is forced to go up and down. This might contribute to Z.
The vibration in Z matches the vibration in X except for the magnitude. Is the X here the sensor’s X or is it the machine X?
If so, I’m not surprised at all about X’s vibration. If you strip the machine down and look at it, it’s clear the two vertical strips are mounted in a way that invites left and right wobble. They are essentially just bolted to a horizontal open rectangle. I’ve thought of making some massive supports and base plates for the two verticals to stiffen them up, but that might then mean a pair of straps on the base rectangle to stiffen that…
Any idea how Nm translates to hand strength? I don’t have a torque wrench unfortunately (I’ve been meaning to buy one a long time but they come in so many varieties I have no idea what to buy).
It could be but it’s still quite odd that it only does it at that particular frequency.
Hmm, that looks like a promising lead, the gyro shows rotation on its “y” reading (sensor “y” is machine “x”). The question is whether sensor “y” is a plane parallel to Y or rotation around Y. I’m guessing the latter? That would mean the spindle is rotating around the X-axis.
If I find that X is a problem, I think I’m going to tear out those rods and replace them with linear rails mounted to an Aluminium plate. I might leave it solid or I might carve out some triangles to make it lighter but leave a rigid coupling in place.
Today I tested nuts but I’ll come back to those later.
I’ve also been testing chatter and Plotly. On the latter, you win @LiamN, it’s much easier to use than Matplotlib and produces nice-looking charts very easily. The code for my new charts is a fraction the size of the old ones.
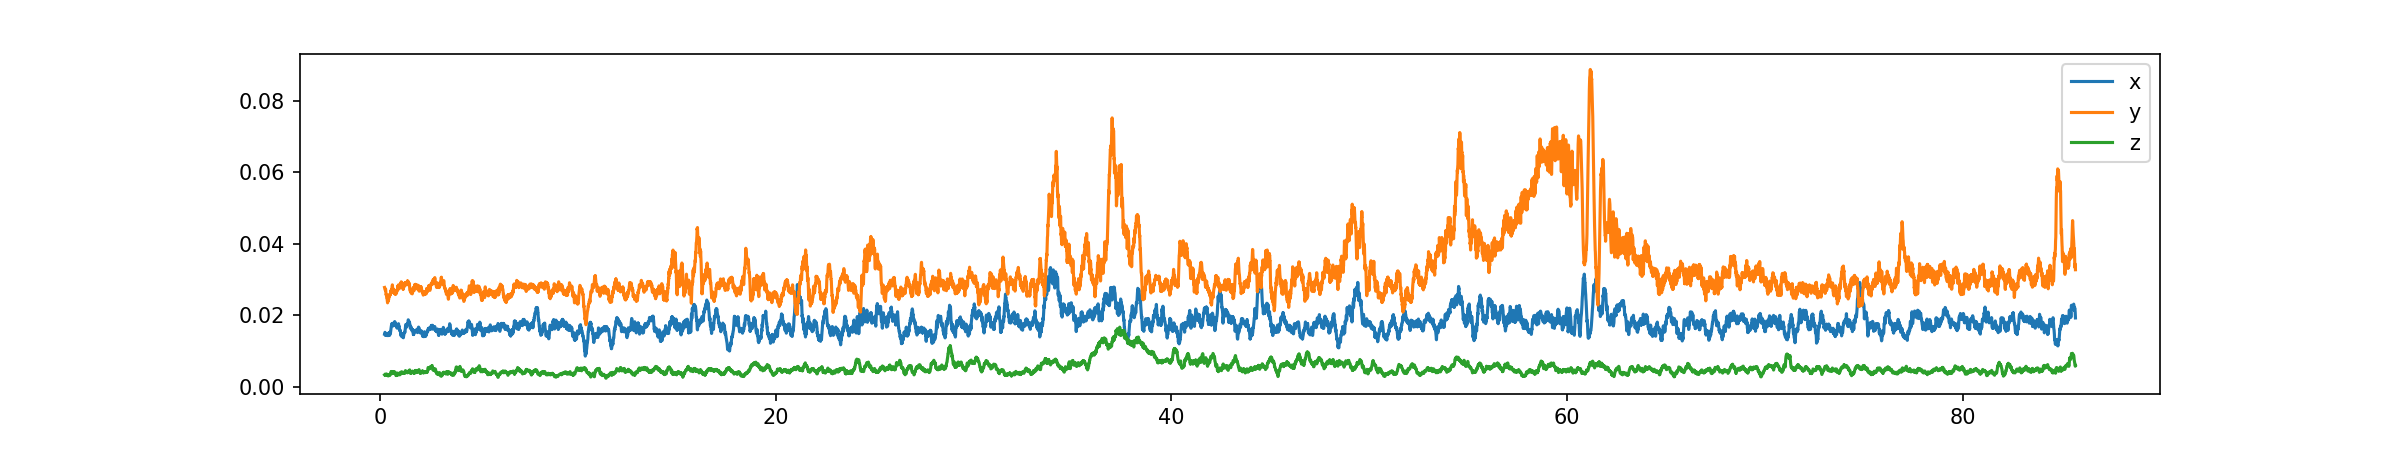
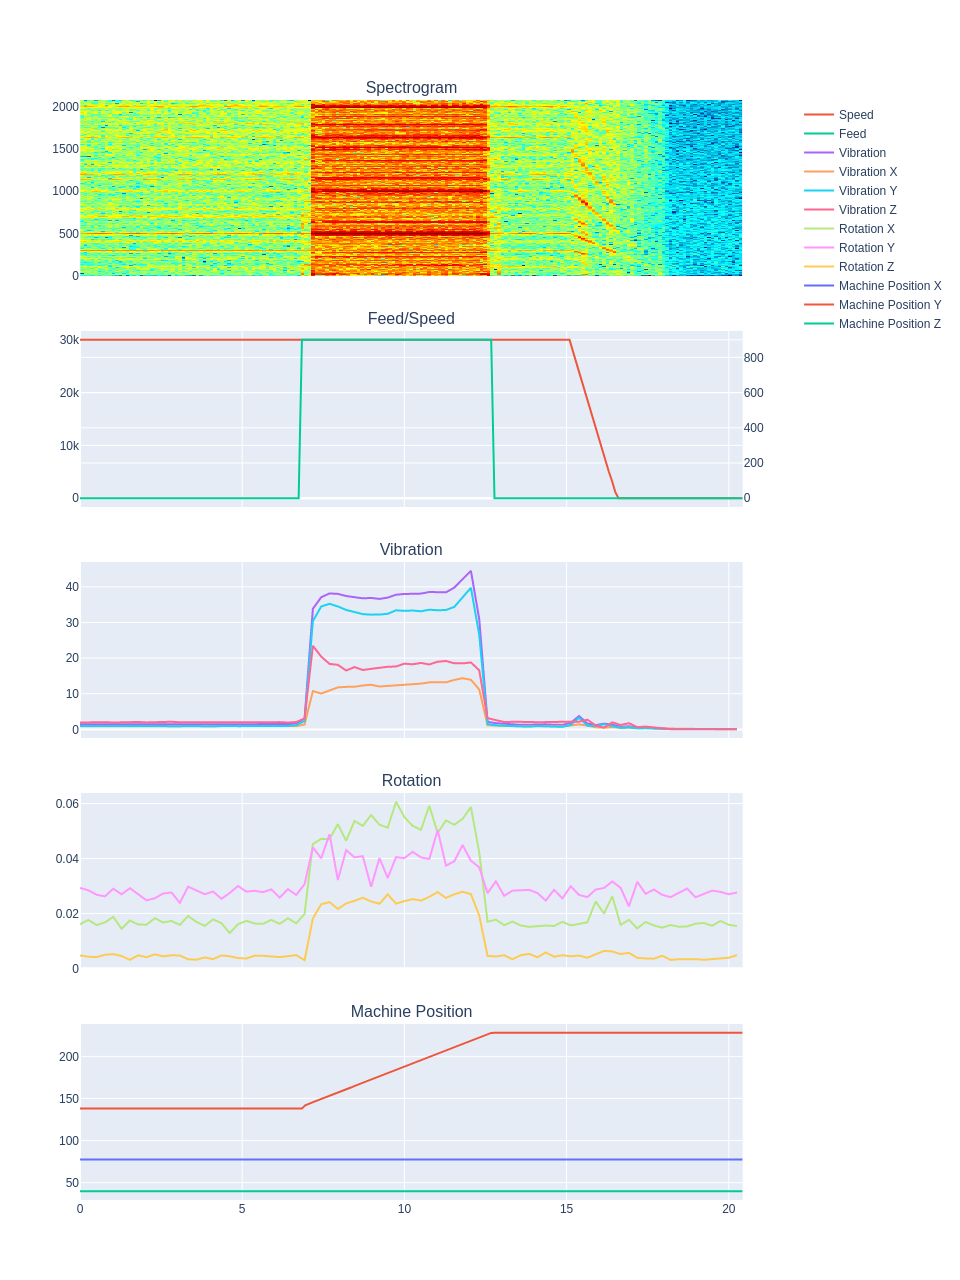
Here’s a chart showing ae 0.4mm, ap 4.2mm, 20kRPM, 30µm fz with a CncFraises single-flute endmill:
Apparently I can even save it as HTML and make it interactive so here you go.
The chatter begins at about 10.65s, you can see that the spectrogram goes from red with a bit of yellow to very very red and at the same time, the Z-axis vibration goes from ~15m/s² to ~20m/s².
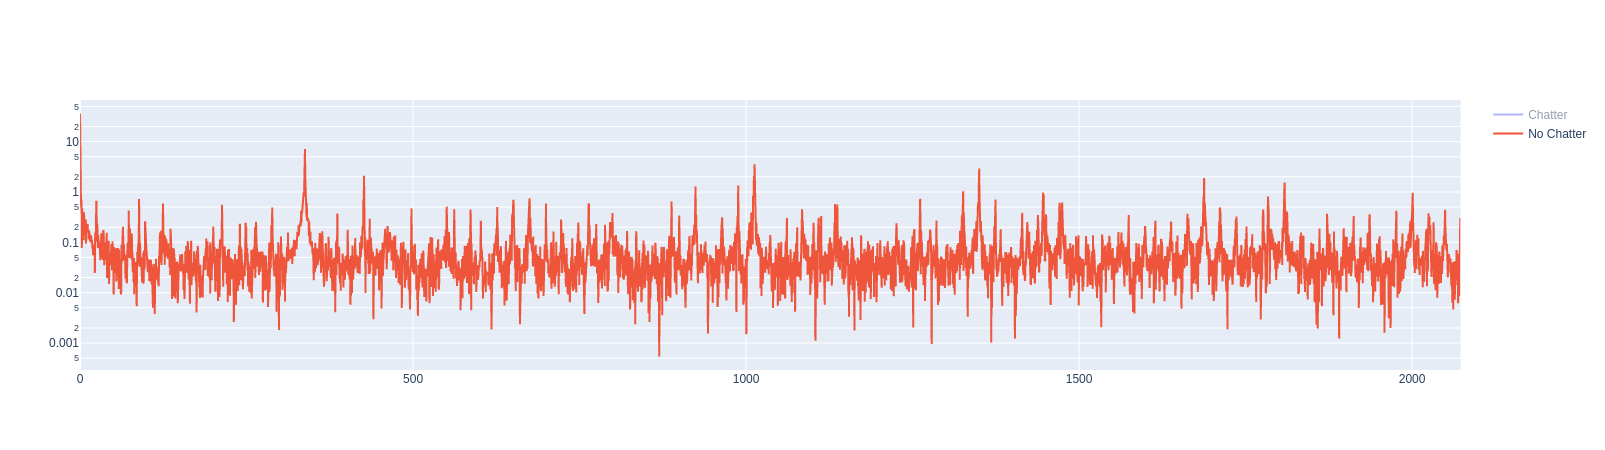
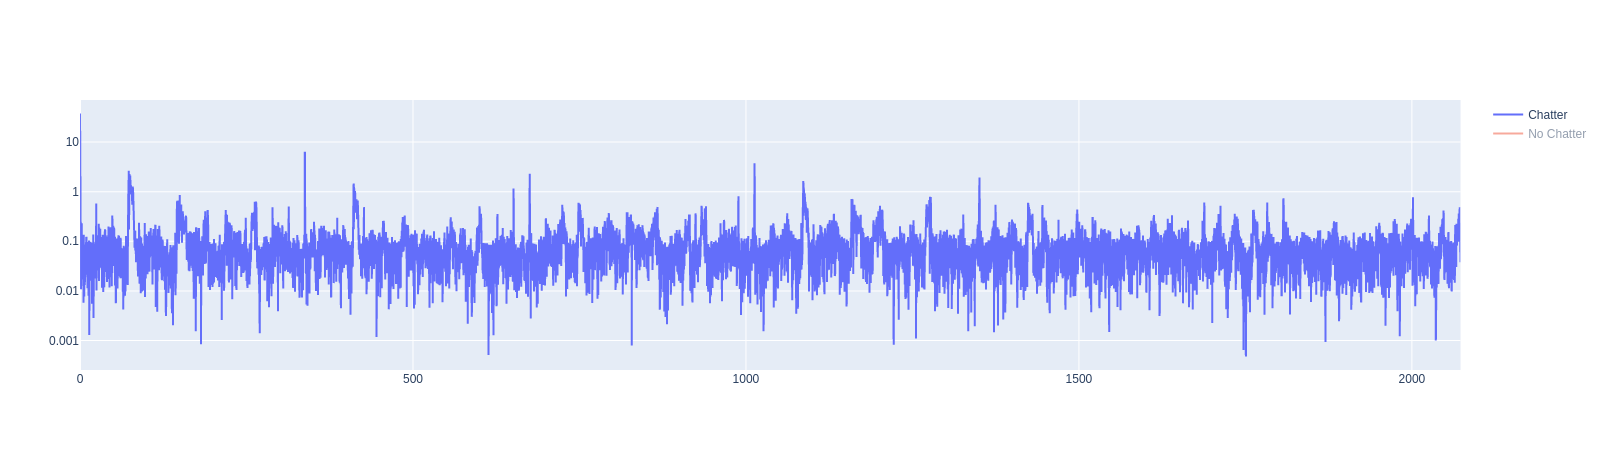
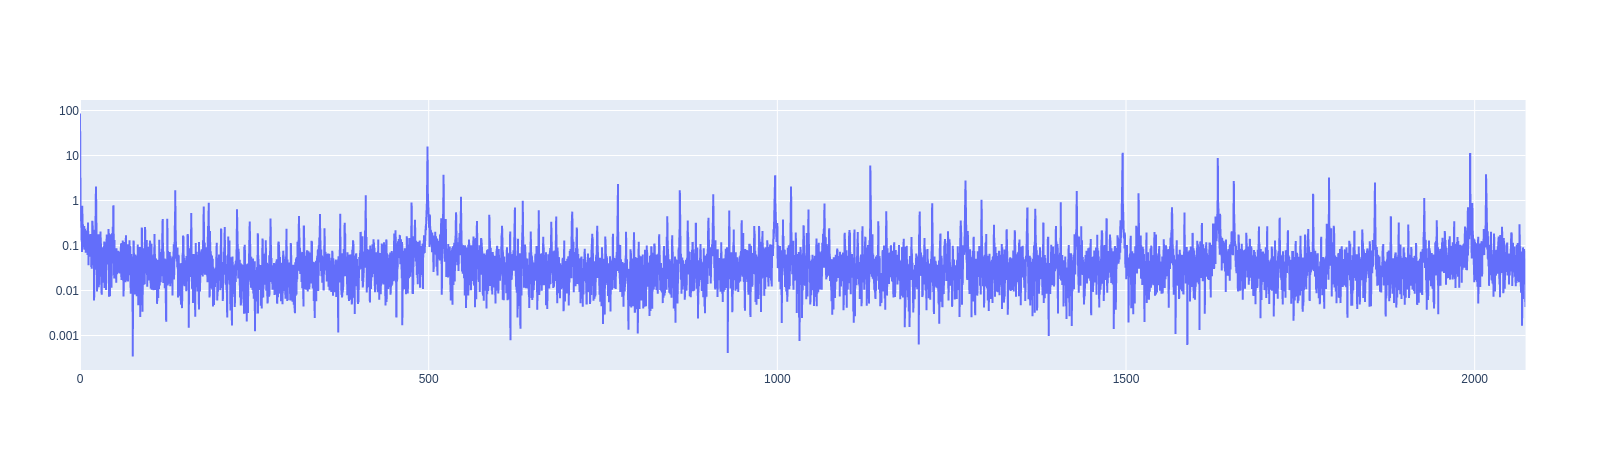
Given I know where there is and isn’t chatter, I can plot an FFT of it:
No chatter mostly has its peaks around multiples of 337 (20k RPM), where we’d expect them:
Not a whole lot interesting going on but you can see that the peaks cluster around multiples of 500 now.
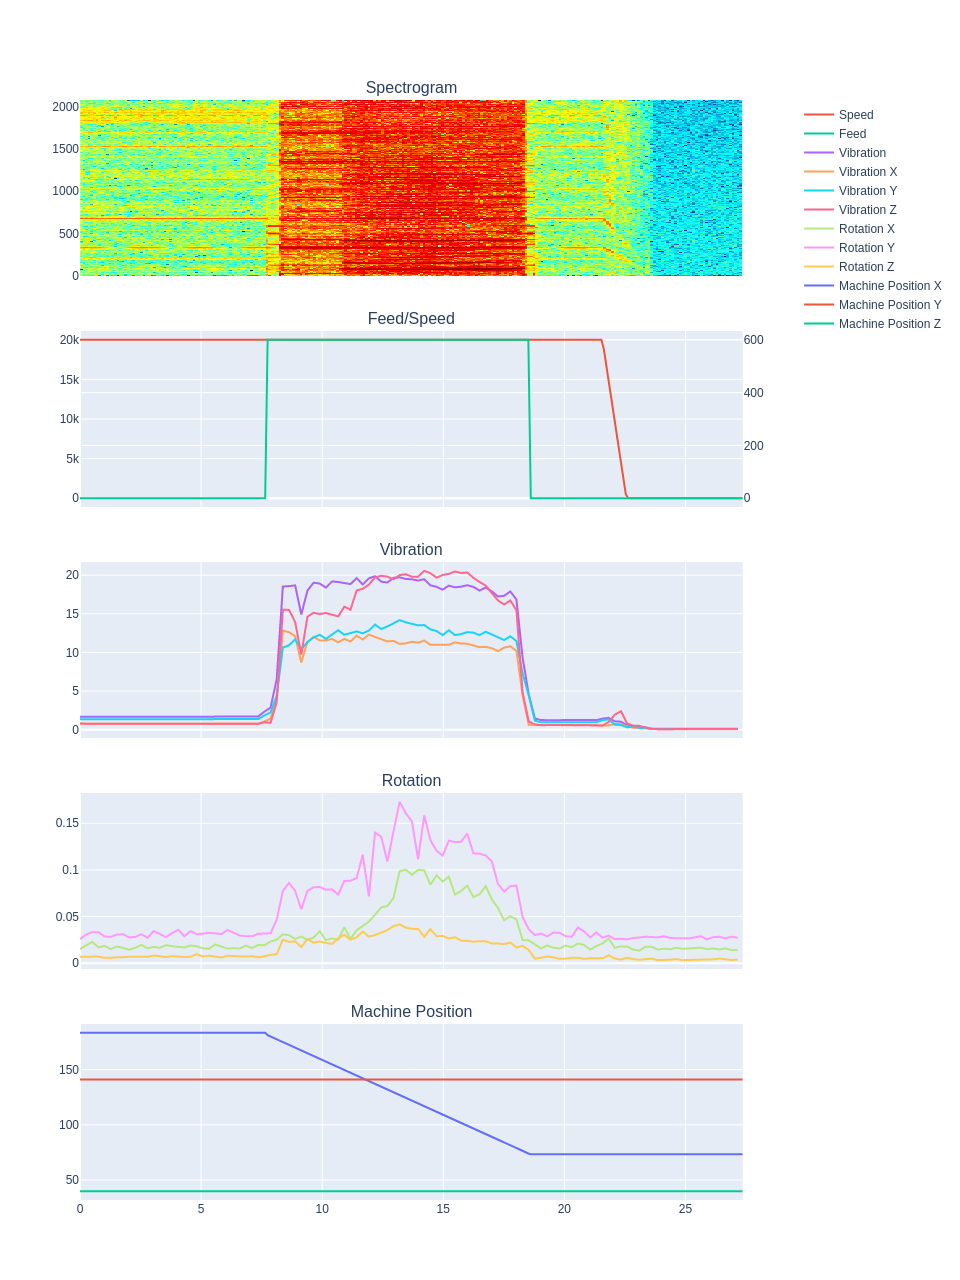
Back to the chatter, here’s an 0.4mm ae, 5mm ap, 30k RPM, 30µm fz (i.e. very similar to the first test) but this time cutting from bottom to top along Y, instead of right to left along X.
So I’m inclined to believe the Z-axis carriage is rotating around the X-axis and the X-axis of my machine is probably the weak point and it’s unlikely that tuning is going to allow me to make consistent high-ap, low-ae cuts.
PLA will dissolve in Acetone, I’d do a sacrificial mount which the sensor screws into. Or use PETG which doesn’t respond to Acetone.
Ideally, yes, but time axis noise in your sampling effectively reduces your highest effective frequency and amplitude readings are a bit iffy right up at the limit so, yes somewhere between 1k and 2k will be good. That’s enough for these experiments anyway.
I would expect the machine resonances to be visible in both cut and spindle & collet tests. There’s only the machine to resonate in the spindle & collet tests so modes found here should also appear in the cutting tests but those may excite things more violently and also produce frequencies from the cut, workpiece etc.
Depends what you’re looking to achieve, if you want a lobe-stability plot for frequencies to avoid then, yes, spindle data is probably enough. If you’re asking where the highest reward fixes are then it may be worth probing the machine a little too. As Gerry says, the Y supports and X rails are an open parallelogram which might benefit from some cross bracing.
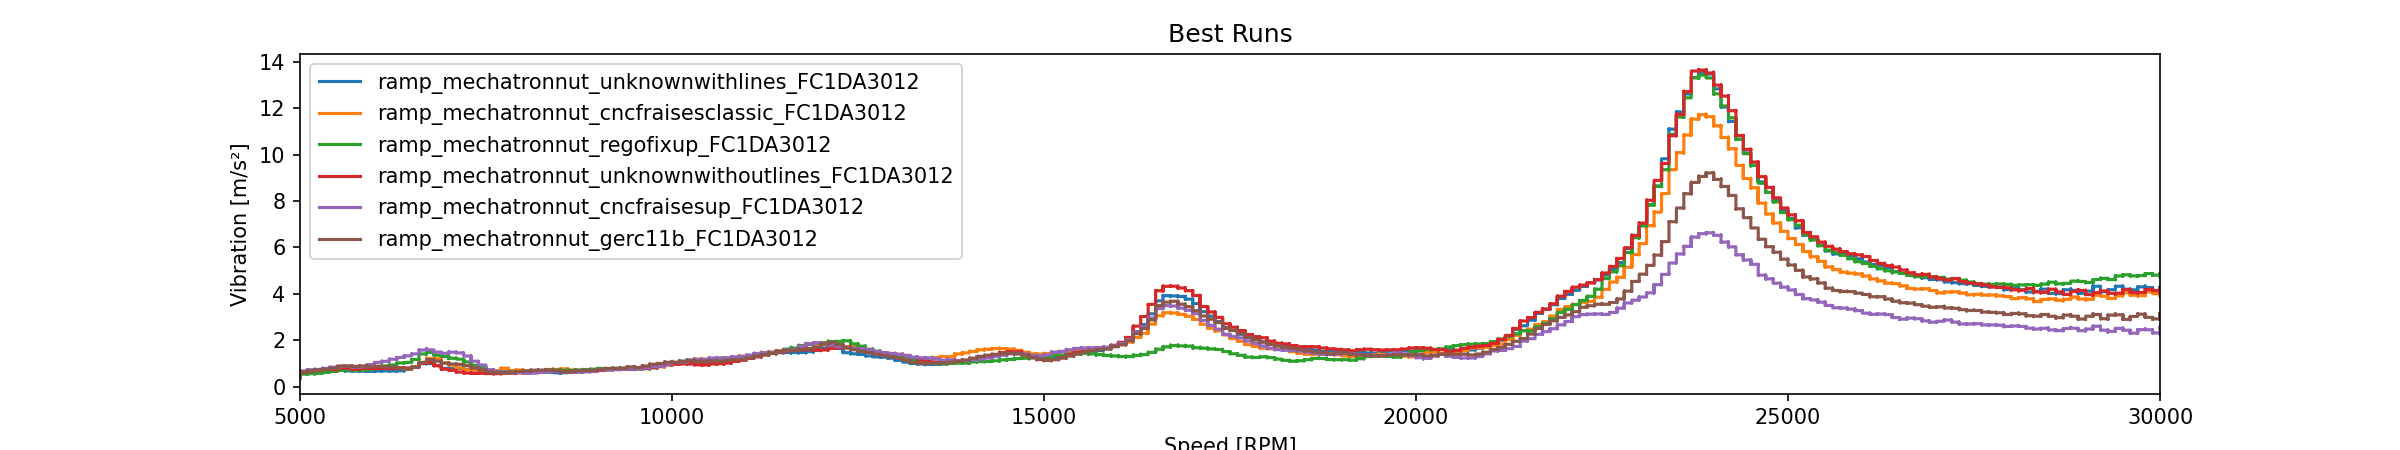
That collet I didn’t include earlier is a sample I was sent from CncFraises that they don’t yet sell but were interested to have tested. It seems to perform the best of all the 1/8" compatible collets I’ve tested so I’ll happily recommend it to European folks when it’s put in the shop.
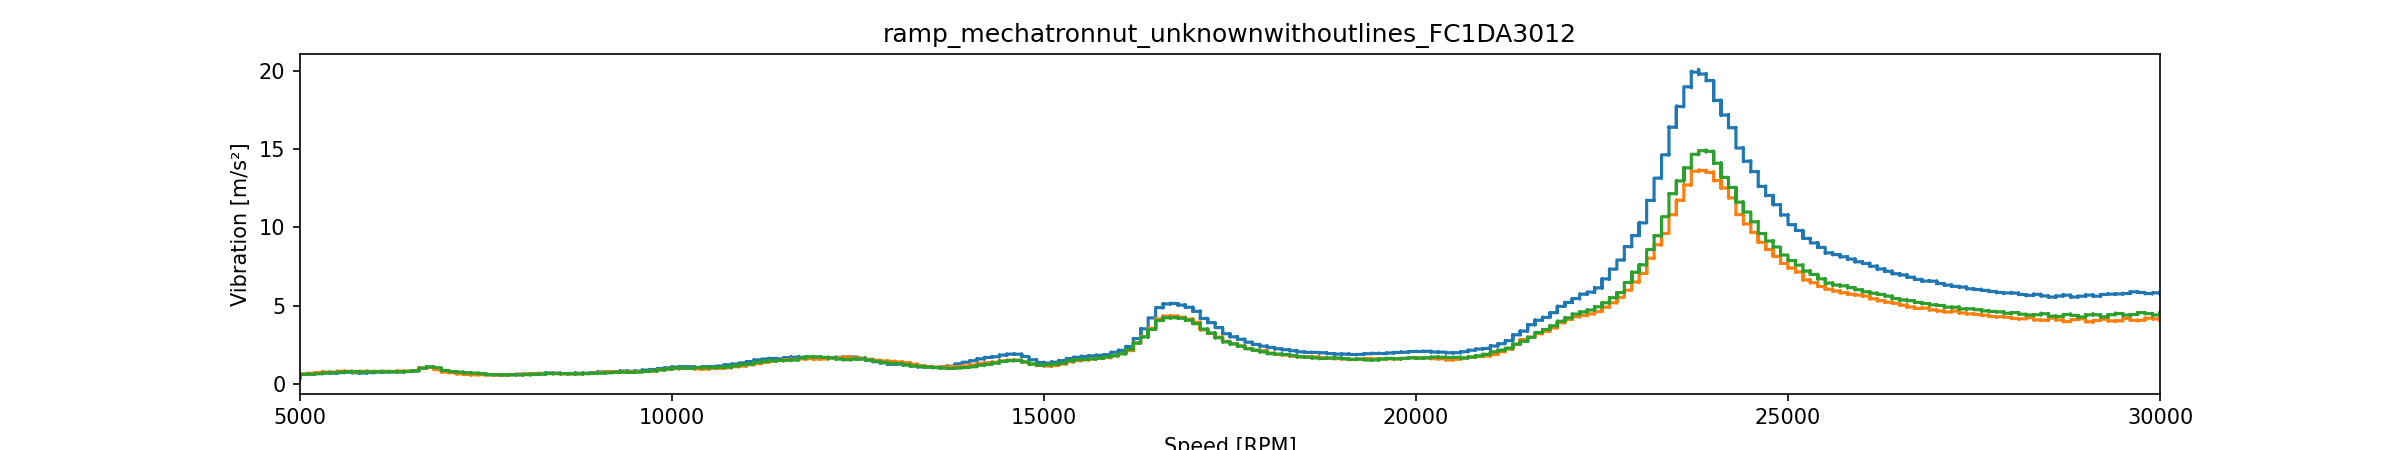
However they also sent me a not-so-great sample “balanced” ER11-A nut (first chart on this post). Seems there might be some kinks to work out in production because it performs by far the worst of all the nuts I have on hand. It’s also the most consistent nut but I don’t think that’s a good thing in this case
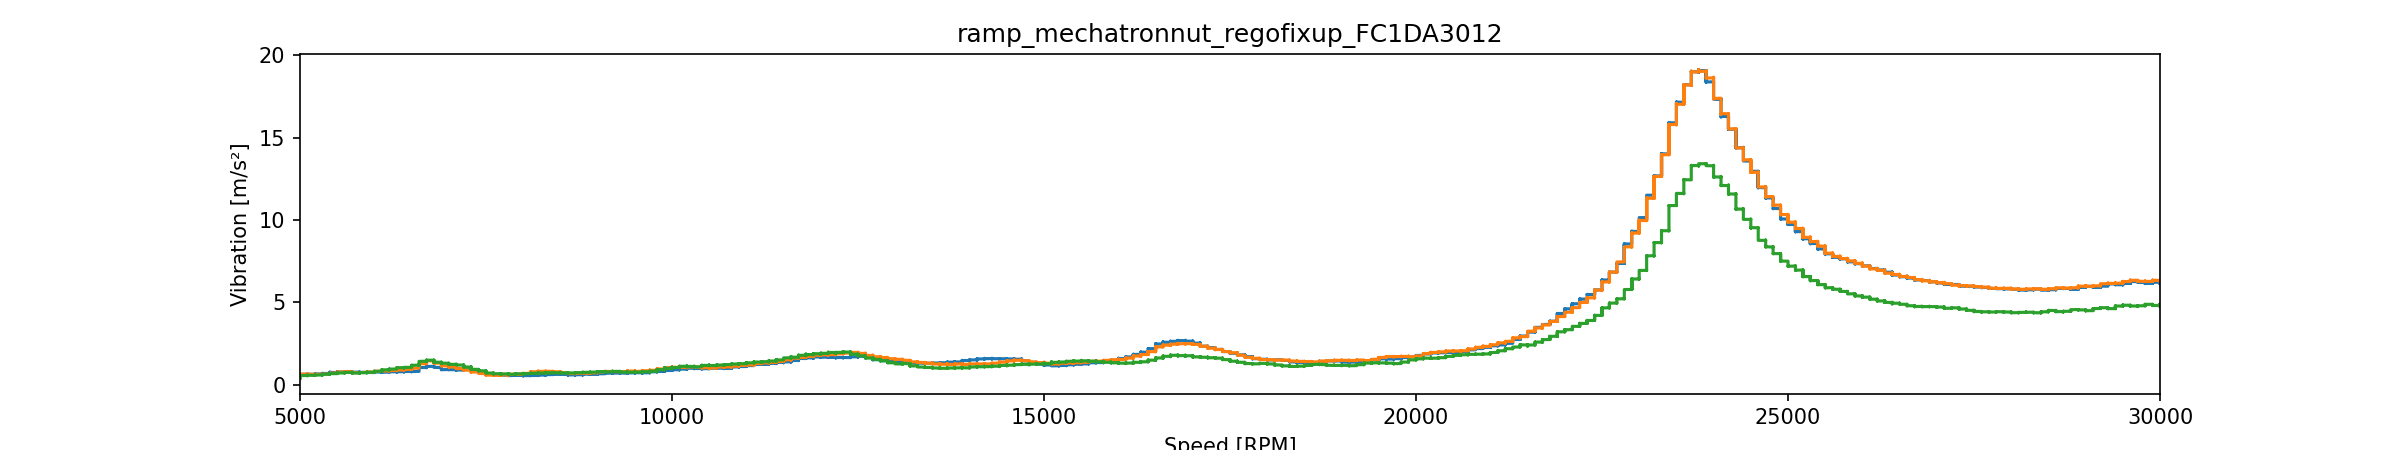
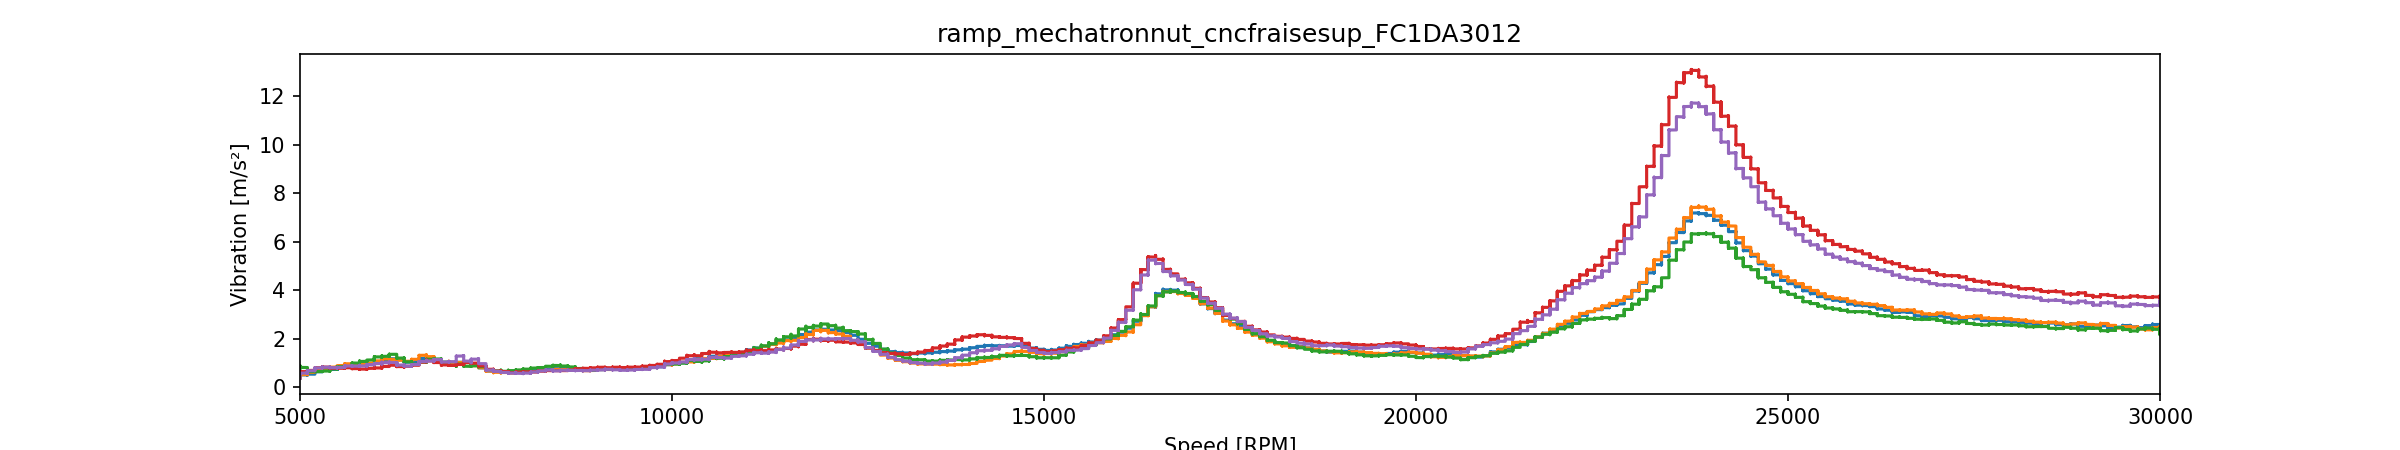
Their other nut is in second place behind the Mechatron nut though.
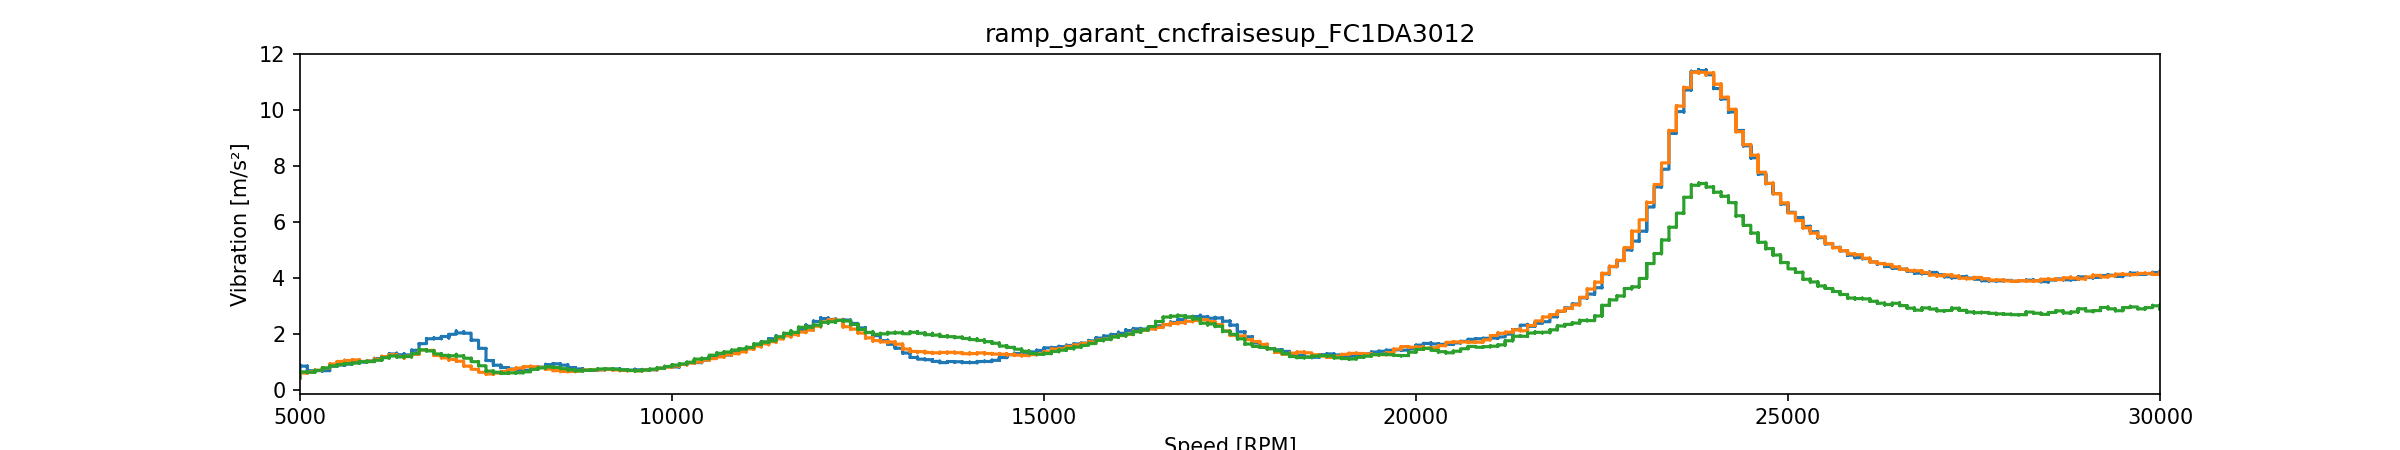
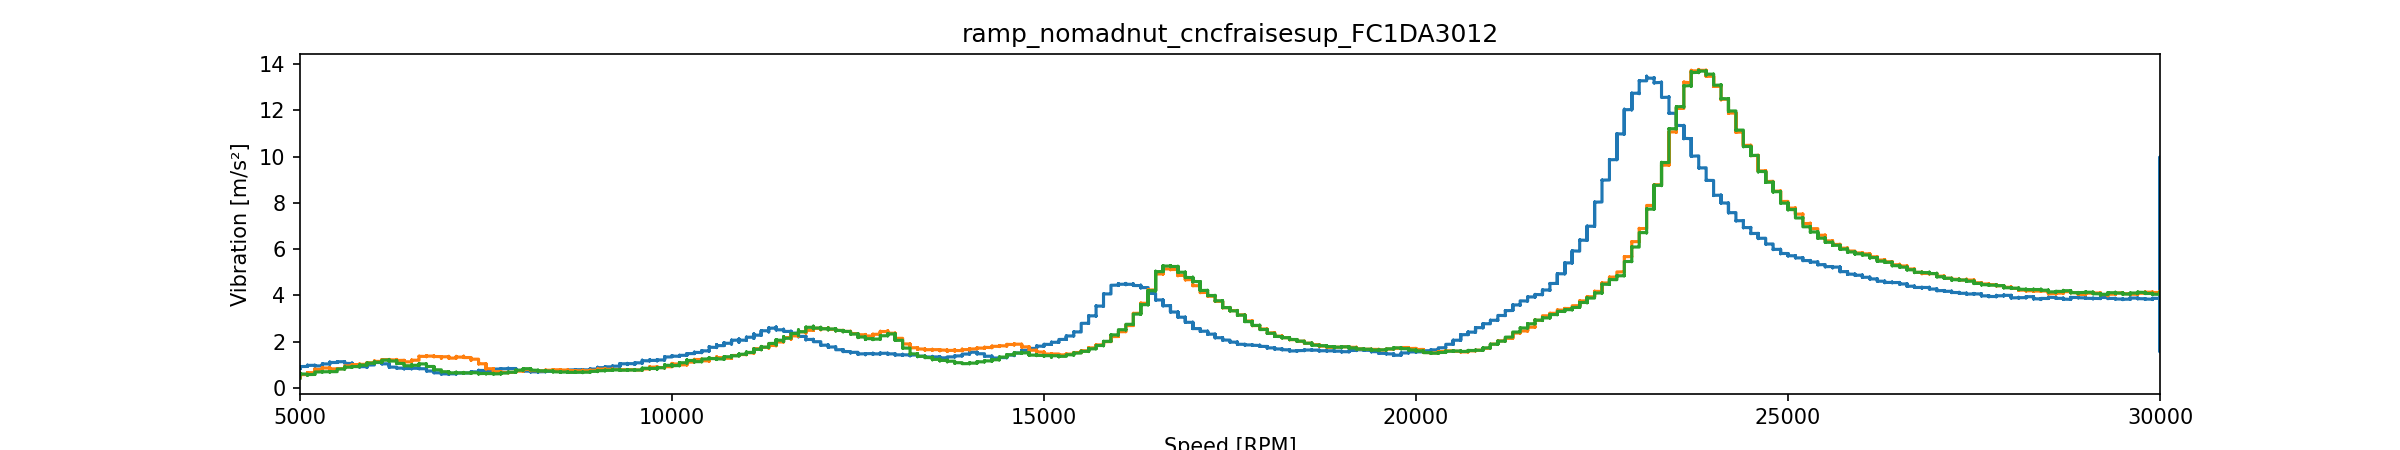
I was also impressed that the Nomad nut did so well, about as good as the Garant nut, which is rated up to 24k RPM.
For now though, I’ll stick with the Mechatron nut. At some point I’d like to test one of the high-speed nuts from REGO-FIX like this one though…